. 2016 Jun 2;165(6):1493-1506.
doi: 10.1016/j.cell.2016.05.003. Epub 2016 May 26.

A Comprehensive, CRISPR-based Functional Analysis of Essential Genes in Bacteria

Affiliations

A Comprehensive, CRISPR-based Functional Analysis of Essential Genes in Bacteria

Jason M Peters et al. Cell. .

Abstract

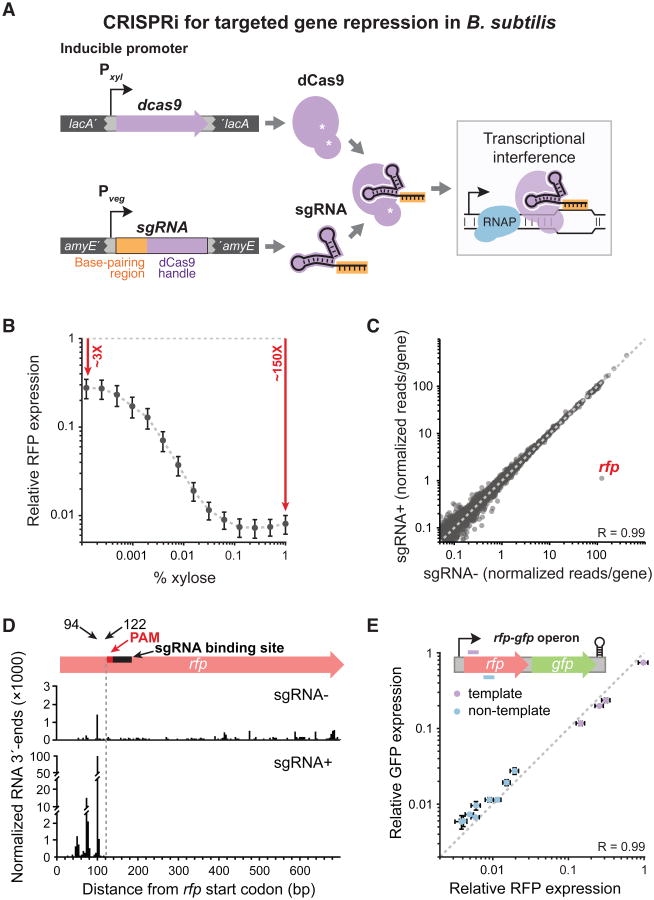
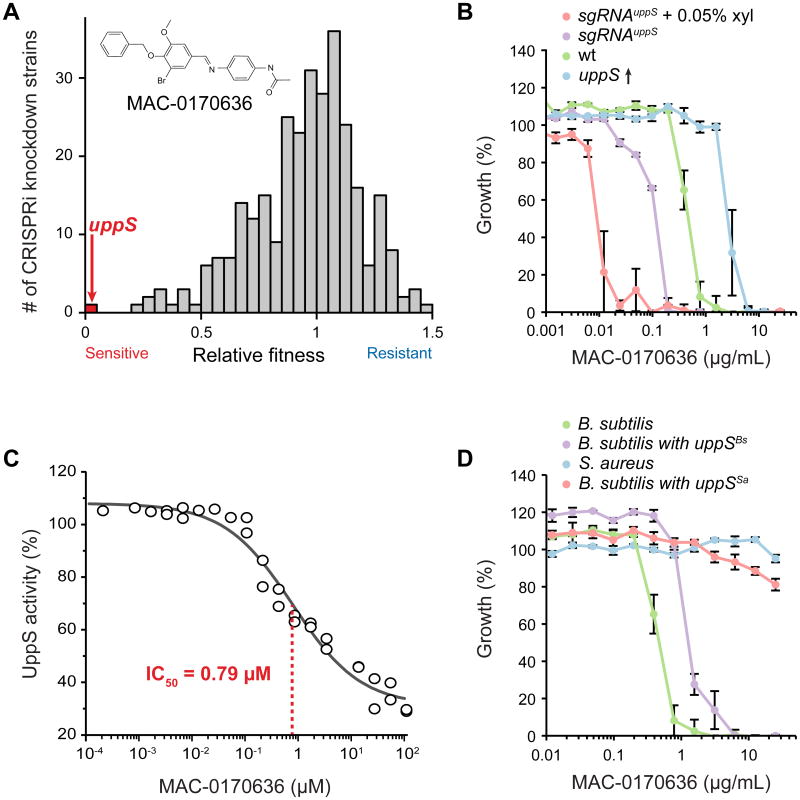
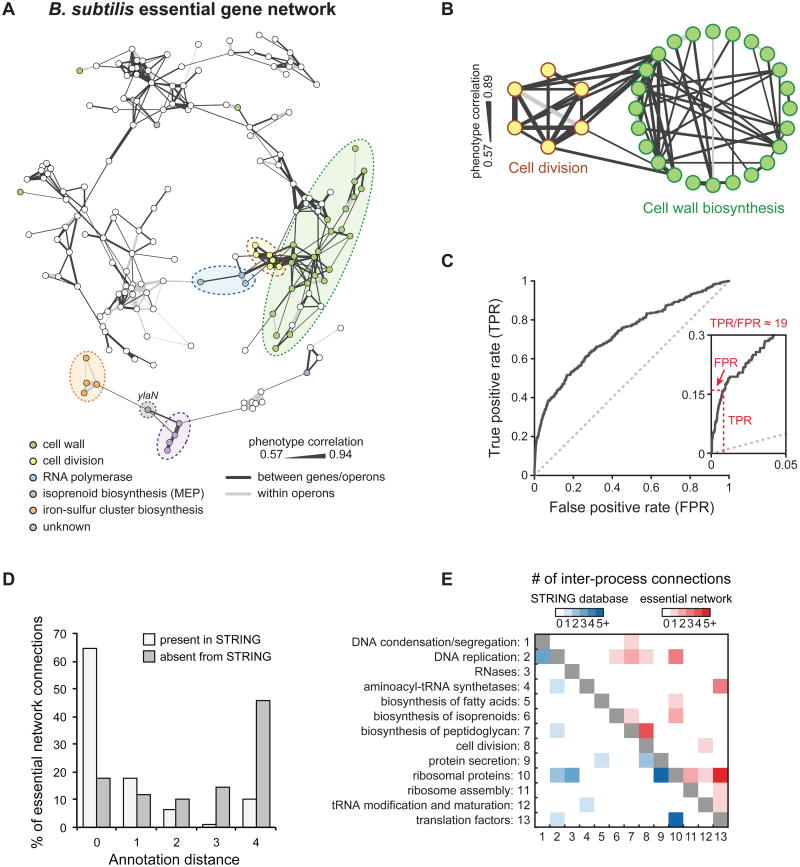
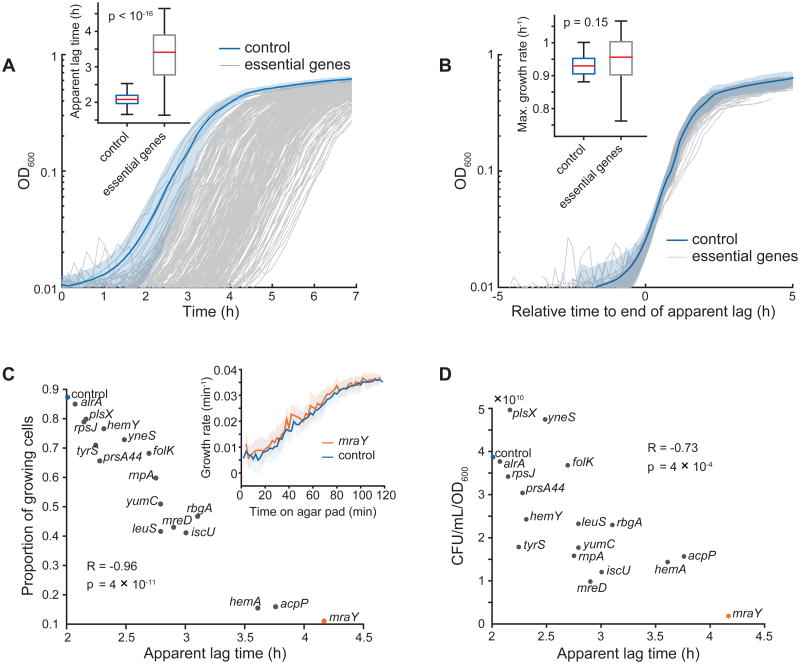
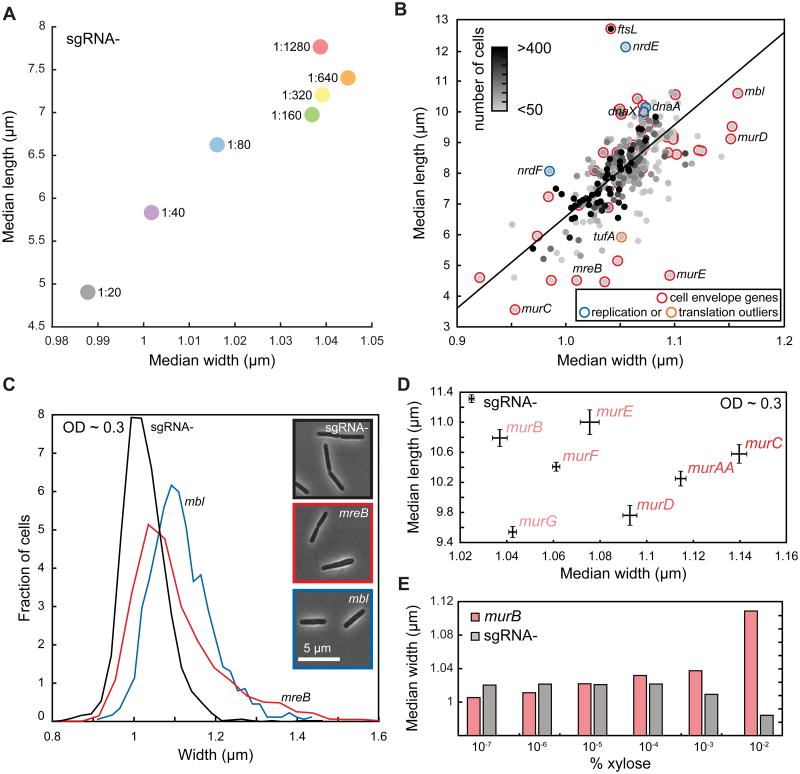
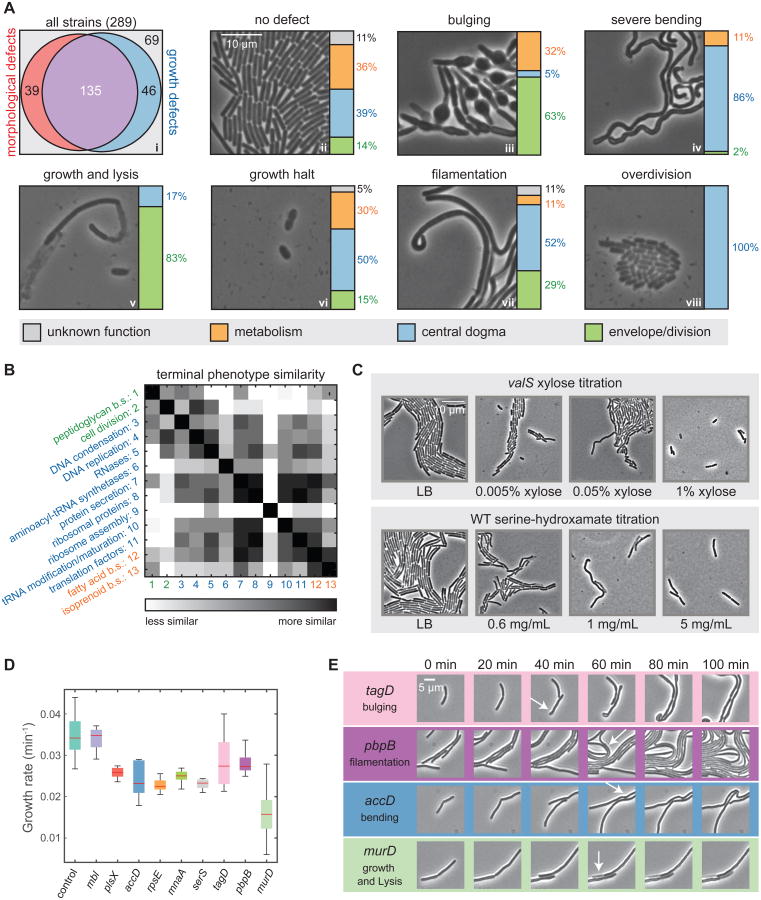
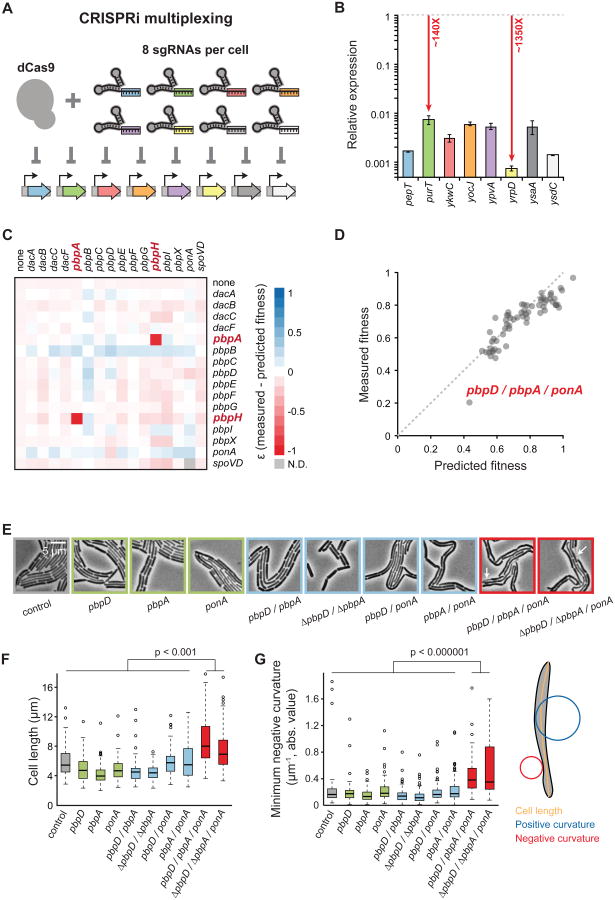
Essential gene functions underpin the core reactions required for cell viability, but their contributions and relationships are poorly studied in vivo. Using CRISPR interference, we created knockdowns of every essential gene in Bacillus subtilis and probed their phenotypes. Our high-confidence essential gene network, established using chemical genomics, showed extensive interconnections among distantly related processes and identified modes of action for uncharacterized antibiotics. Importantly, mild knockdown of essential gene functions significantly reduced stationary-phase survival without affecting maximal growth rate, suggesting that essential protein levels are set to maximize outgrowth from stationary phase. Finally, high-throughput microscopy indicated that cell morphology is relatively insensitive to mild knockdown but profoundly affected by depletion of gene function, revealing intimate connections between cell growth and shape. Our results provide a framework for systematic investigation of essential gene functions in vivo broadly applicable to diverse microorganisms and amenable to comparative analysis.


Figures

Figure 1
Figure 1. B. subtilis CRISPRi is Efficient, Titratable, and Specific
A) B. subtilis xylose-inducible dCas9 is directed to specific DNA targets by constitutively expressed sgRNAs, where it represses transcription. dcas9 was stably integrated into the lacA locus, and sgRNAs into amyE or thrC. B) Flow cytometry of cells that constitutively express rfp and an rfp-targeted sgRNA, in which dcas9 was induced by adding the specified concentration of xylose. Median RFP levels are relative to the no-sgRNA control (grey dashed line), and error bars are ±1 standard deviation. C) RNA-seq of cells maximally induced for dcas9 (1% xylose) and constitutively expressing rfp and an rfp-targeted sgRNA versus cells without an sgRNA. Reads per gene were normalized by reads per kilobase per million reads. The dashed line is y = x. D) NET-seq of cells maximally induced for dcas9 (1% xylose) and constitutively expressing rfp and an rfp-targeted sgRNA versus cells without an sgRNA. The y-axis is broken to accommodate the wide range of reads. The dashed line corresponds to the upstream boundary of the PAM sequence. We suggest that RNA 3′ end peaks upstream of the dCas9 block result from RNA polymerase queuing. E) Flow cytometry of cells maximally induced for dcas9 (1% xylose) and constitutively expressing an rfp-gfp operon and various rfp-targeting sgRNAs. RFP and GFP levels are relative to the no-sgRNA control. The dashed line is y = x. Note that in this group of sgRNAs, only template strand-targeting sgRNAs exhibited low efficacy (violet).
Figure 2
Figure 2. CRISPRi Knockdowns of Essential Genes Enable Discovery of Direct Antibiotic Targets
A) Relative fitness of CRISPRi essential gene knockdown strains (n = 289) with basal dcas9 expression (no xylose induction) grown on plates containing MAC-0170636, as determined by the ratio of normalized colony sizes on LB plates + DMSO versus LB + MAC-0170636. B) Minimal inhibitory concentration (MIC) assay for strains over- or under-expressing uppS grown in liquid medium containing MAC-0170636. The MICs of these strains were (in μg/ml): sgRNAuppS + 0.05% xyl (∼0.012), sgRNAuppS (∼0.195), WT (∼0.78), and uppS overexpression (∼3.125). The values plotted are the means of at least three measurements, and error bars are ±1 standard deviation. C) Concentration-dependent inhibition of purified B. subtilis UppS by MAC-0170636. Each point is an individual measurement. D) MIC assay for strains expressing B. subtilis uppS (BsΔuppS/amyE∷Pspank-uppSBs) or S. aureus uppS (BsΔuppS/amyE∷Pspank-uppSSa) grown in liquid LB + MAC-0170636.
Figure 3
Figure 3. An Essential Gene Network Reveals Numerous Intra- and Inter-process Connections
A) Essential gene network based on correlations between chemical-gene phenotypes. Edge thickness is proportional to the extent of correlation. See also Figure S3 for network gene names. B) Intra- and inter-process connections between cell division and cell wall-biosynthesis genes. Genes outside the main network or genes lacking intra-process connections were excluded. C) ROC curve comparing connections between essential operons in our network to the STRING database. True-positive connections are those present in the high-confidence set of interactions from STRING, and false-positive connections are absent from STRING (these connections may be either truly false or novel). D) Annotation distance for network connections between essential operons present or absent from the STRING database. Genes with an annotation distance of 0 are from the same functional group, while genes with an annotation distance of 4 are unconnected by annotation. E) Functional annotations for intra-process connections between essential operons present in the STRING database or present in our essential network.
Figure 4
Figure 4. High-resolution Growth Profiles of Essential Gene Knockdowns Reveal Widespread Defects in Stationary-phase Survival
A) Microplate reader growth curves of essential gene knockdown library strains. We grew cells for 18 h in LB before back-diluting into fresh LB (t = 0). Shaded area is mean ± standard deviation (S.D.) for the no-sgRNA control, n = 23. B) Growth curves from A with the apparent lag time of each strain shifted to zero. Shaded area is mean ± S.D. for the no-sgRNA control, n = 23. C) Data extracted from single-cell, time-lapse microscopy of selected essential gene knockdown strains grown on agarose pads with fresh LB after liquid growth in LB for 18 h. Although fewer mraY knockdown cells grow on LB pads after 18 h (11% versus 87% for the no-sgRNA control), the growth rate of elongating cells quantitatively matches that of the control (inset). D) Viable cell plating of selected essential gene knockdown strains grown in LB for 18 h. CFU: colony-forming units.
Figure 5
Figure 5. Partial Knockdown of Essential Genes Identifies Potential Morphological Regulators, with Envelope Gene Knockdown Leading to Changes in Cell Width
A) Cell volume of the no-sgRNA control varies substantially after 3.5 h of growth across dilutions of the same overnight culture into fresh LB. Cell length and width were highly correlated (Pearson's R = 0.96, p<0.001). B) Median cell length and width of essential knockdown strains are highly correlated after 3.5 h of growth (Pearson's R = 0.66, p<10−38). “Cell envelope” is the only functional category that is enriched in the outliers to the best-fit line (black) between length and width. Selected non-cell envelope outliers in DNA replication (blue) and translation (orange) are also shown. C) Distribution of cell widths of mbl and mreB knockdown strains at OD600∼0.3 reveals subtle distinctions between the two actin homologs, with mbl cells wider than no-sgRNA control cells and mreB cells adopting a broader range of widths. n > 2000 cells for each histogram. D) Knockdown strains in the mur pathway have similar median cell length at OD600∼0.3, while cell width varies over a wide range. Bars represent standard error of the mean. E) Cell width of the murB knockdown strain increases monotonically with the degree of dcas9 induction, in contrast to the no-sgRNA control.
Figure 6
Figure 6. Essential Gene Depletion Reveals a Diversity of Terminal Phenotypes
A) (i) Area-proportional graph of the fraction of essential gene knockdowns that give rise to morphological and growth terminal phenotypes. (ii-viii) Single-cell imaging of common terminal phenotypes of essential-gene knockdowns, with bar graphs depicting the broad functional categories underlying each terminal phenotype. B) Matrix of the similarity of terminal phenotypes achieved by genes belonging to the most common essential-gene functional groups. b.s., biosynthesis. C) Titrated depletion of the valS knockdown and inhibition of WT by serine hydroxamate led to similar trends in terminal phenotypes, from over-division to filamenting and bending, and finally growth halting. D) Post-induction growth rates of selected strains with different terminal phenotypes. Most strains reduced growth rates by 20-30% in the first hour, except for murD and mbl. murD had a larger decrease in growth rate, whereas mbl had a similar growth rate as the no-sgRNA control. E) Morphological phenotypes during depletion post-CRISPRi induction. Phenotypes were observable by 40-60 min post-induction.
Figure 7
Figure 7. Multiplexed CRISPRi Knockdowns Facilitate Genetic Analysis of Complex Pathways
A) Schematic of knockdown of eight genes in a single cell. Knockdowns correspond to the genes in (B). B) Quantitative PCR of RNA levels in the eight-gene knockdown strain at maximal dcas9 induction (1% xylose). Expression is relative to the no-sgRNA control. Points are the means of at least three measurements, and error bars are ±1 standard deviation. C) The difference between measured and predicted fitness (ε, Extended Experimental Procedures) for each pbp double knockdown based on normalized colony size at maximal dcas9 induction (1% xylose). Negative and positive ε represent reduced or improved fitness, respectively. D) Measured versus predicted fitness of pbp triple knockdowns based on normalized colony size at maximal dcas9 induction (1% xylose). E) Terminal phenotypes of pbp knockdown strains. Arrows indicate lysed cells. F) Box plots of cell length from pbp knockdowns in E. n > 100 cells for each strain. G) Box plots of cell curvature from pbp knockdowns in E. n > 100 cells for each strain.

Similar articles

Cited by

References

    1. Arjes HA, Kriel A, Sorto NA, Shaw JT, Wang JD, Levin PA. Failsafe mechanisms couple division and DNA replication in bacteria. Curr Biol CB. 2014;24:2149–2155. - PMC - PubMed
    1. Baba T, Ara T, Hasegawa M, Takai Y, Okumura Y, Baba M, Datsenko KA, Tomita M, Wanner BL, Mori H. Construction of Escherichia coli K-12 in-frame, single-gene knockout mutants: the Keio collection. Mol Syst Biol. 2006;2:2006.0008. - PMC - PubMed
    1. Blomen VA, Májek P, Jae LT, Bigenzahn JW, Nieuwenhuis J, Staring J, Sacco R, van Diemen FR, Olk N, Stukalov A, et al. Gene essentiality and synthetic lethality in haploid human cells. Science. 2015;350:1092–1096. - PubMed
    1. Breslow DK, Cameron DM, Collins SR, Schuldiner M, Stewart-Ornstein J, Newman HW, Braun S, Madhani HD, Krogan NJ, Weissman JS. A comprehensive strategy enabling high-resolution functional analysis of the yeast genome. Nat Methods. 2008;5:711–718. - PMC - PubMed
    1. Busiek KK, Margolin W. Bacterial actin and tubulin homologs in cell growth and division. Curr Biol CB. 2015;25:R243–R254. - PMC - PubMed

Publication types