. 2016 Nov;65(5):888-898.
doi: 10.1016/j.jhep.2016.05.022. Epub 2016 May 26.

EpCAM-regulated intramembrane proteolysis induces a cancer stem cell-like gene signature in hepatitis B virus-infected hepatocytes

Affiliations

EpCAM-regulated intramembrane proteolysis induces a cancer stem cell-like gene signature in hepatitis B virus-infected hepatocytes

Saravana Kumar Kailasam Mani et al. J Hepatol. 2016 Nov.

Abstract

Background & aims: Hepatocytes in which the hepatitis B virus (HBV) is replicating exhibit loss of the chromatin modifying polycomb repressive complex 2 (PRC2), resulting in re-expression of specific, cellular PRC2-repressed genes. Epithelial cell adhesion molecule (EpCAM) is a PRC2-repressed gene, normally expressed in hepatic progenitors, but re-expressed in hepatic cancer stem cells (hCSCs). Herein, we investigated the functional significance of EpCAM re-expression in HBV-mediated hepatocarcinogenesis.

Methods: Employing molecular approaches (transfections, fluorescence-activated cell sorting, immunoblotting, qRT-PCR), we investigated the role of EpCAM-regulated intramembrane proteolysis (RIP) in HBV replicating cells in vitro, and in liver tumors from HBV X/c-myc mice and chronically HBV infected patients.

Results: EpCAM undergoes RIP in HBV replicating cells, activating canonical Wnt signaling. Transfection of Wnt-responsive plasmid expressing green fluorescent protein (GFP) identified a GFP + population of HBV replicating cells. These GFP+/Wnt+ cells exhibited cisplatin- and sorafenib-resistant growth resembling hCSCs, and increased expression of pluripotency genes NANOG, OCT4, SOX2, and hCSC markers BAMBI, CD44 and CD133. These genes are referred as EpCAM RIP and Wnt-induced hCSC-like gene signature. Interestingly, this gene signature is also overexpressed in liver tumors of X/c-myc bitransgenic mice. Clinically, a group of HBV-associated hepatocellular carcinomas was identified, exhibiting elevated expression of the hCSC-like gene signature and associated with reduced overall survival post-surgical resection.

Conclusions: The hCSC-like gene signature offers promise as prognostic tool for classifying subtypes of HBV-induced HCCs. Since EpCAM RIP and Wnt signaling drive expression of this hCSC-like signature, inhibition of these pathways can be explored as therapeutic strategy for this subtype of HBV-associated HCCs.

Lay summary: In this study, we provide evidence for a molecular mechanism by which chronic infection by the hepatitis B virus results in the development of poor prognosis liver cancer. Based on this mechanism our results suggest possible therapeutic interventions.

Keywords: BAMBI; CD133; CD44; EpCAM-regulated intramembrane proteolysis; Hepatitis B virus; Hepatocellular carcinoma; Pluripotency genes (NANOG, OCT4 and SOX2); SUZ12/polycomb repressive complex 2; Wnt signaling.


Figures

Fig. 1
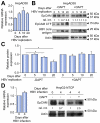
Fig. 1. HBV replication induces regulated intramembrane proteolysis of EpCAM
(A) PCR quantification of EpCAM mRNA isolated from HepAD38 cells at 0–20 days after onset of HBV replication. (B) Immunoblots of EpCAM, HBV core antigen (HBV replication control) and actin isolated at 0, 5, 10 and 20 days after onset of HBV replication without (−) or with (+) 10 μM DAPT (γ-secretase inhibitor) treatment for 24 h. (C) ImageJ quantification of EpCAM protein levels from Fig. 1B normalized to actin. (n = 3) (*indicates p <0.05). (D) PCR quantification of EpCAM mRNA and immunoblots of EpCAM from uninfected (Day 0) and HBV infected (Day 4) HepG2-NTCP cells without (−) and with (+) 10 μM DAPT treatment for 24 h.
Fig. 2
Fig. 2. HBV replication activates Wnt signaling via EpCAM RIP
(A) Luciferase activity in HepAD38 cells without (−) or with (+) HBV replication for 5–20 days, following transient co-transfection of TOPflash or FOPflash and Renilla luciferase reporters with (+) EpCAM siRNAs (siEpCAM#1 or siEpCAM#2) and scrambled siRNA (−) (n = 3). Immunoblots of EpCAM employing EpCAM siRNAs (siEpCAM#1 or siEpCAM#2). (B) β-catenin immunofluorescence of HepAD38 cells on Day 0 and Day 10 of HBV replication, with DAPT treatment and EpCAM knockdown by siRNA transfection. (C) Luciferase activity in uninfected (Day 0) and HBV infected (Day 4) HepG2-NTCP cells, co-transfected with TOPflash and Renilla luciferase reporters, without (−) and with (+)10 μM DAPT treatment for 24 h. (n = 3, *indicates p <0.05).
Fig. 3
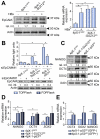
Fig. 3. EpCAM RIP in SUZ12 knockdown cells activates Wnt signaling
(A) Immunoblots of EpCAM and PCR quantification of EpCAM mRNA employing 4pX-1GIPZ and 4pX-1-SUZ12KD cells without (−) or with (+) HBx, expressed for 18 h by tetracycline removal. (B) Luciferase activity in indicated cell lines following transient co-transfections of TOPflash or FOPflash and Renilla luciferase reporters with siEpCAM#1 (+) or scrambled siRNA (−) (n = 3). Immunoblot of EpCAM in indicated cell lines following transfection of siEpCAM#1 (+) or scrambled siRNA (−). (C) Immunoblots of NANOG, OCT4, SOX2 and actin with lysates from indicated cell lines. (D) PCR quantification of pluripotency gene mRNAs in indicated cell lines (n = 3). (E) 4pX-1-p53KD cells, transiently transfected (48 h) with TOPGFP plasmid expressing mCherry constitutively, were sorted by FACS. Total RNA isolated from sorted cells was used to quantify mRNA levels of indicated genes. (n = 3, *indicates p <0.05).
Fig. 4
Fig. 4. Enhanced expression of hCSC markers and pluripotency genes in GFP+/Wnt+ HBV replicating cells
(A) FACS of GFP+ and GFP HepAD38 cells, transfected with TOPGFP on Day 0 and Day 10 of HBV replication, with (+) or without (−) EpCAM knockdown. (B) Percent GFP+ cells quantified from (A), including treatment with 2.5 mM LiCl for 24 h (n = 2) (C) PCR quantification of mRNA expression of indicated genes using total RNA isolated from HBV replicating mCherry+/GFP+ and mCherry+/GFP HepAD38 cells (n = 3). (D) SUZ12 immunoblots from uninfected HepG2-NTCP cells (Day 0), HBV infected HepG2-NTCP cells (Day 4), HepAD38 cells without HBV replication (Day 0) and FACS sorted HBV replicating HepAD38 cells (Day 20 of HBV replication). (E) Cell viability of sorted GFP+ and GFP HepAD38 HBV replicating cells (5,000 cells from each sorting experiment) plated in triplicates, and treated with indicated concentration of cisplatin or sorafenib. MTS assays were performed 18 h after treatment, according to manufacturer’s instructions (n = 3, *indicates p <0.05). (F) Cell viability of HBV replicating HepAD38 cells, on day 10 of HBV replication; 20,000 cells plated in triplicates, and treated with indicated concentration of cisplatin or sorafenib. MTS assays performed 18 h after treatment, according to manufacturer’s instructions (n = 3, *indicates p <0.05).
Fig. 5
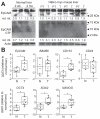
Fig. 5. EpCAM RIP and expression of hCSC-like gene signature in liver tumors from X/c-myc mice
(A) EpCAM immunoblots using lysates from normal mouse liver (2 weeks and 4 months), peritumoral (PT) and tumor (T) liver tissues obtained from 12-month X/c-myc mice. *indicates EpCAM processing fragments. EpCAM CTF detected by 15% SDS PAGE, transferred to polyvinylidene difluoride (PVDF) membrane for immunoblotting with EpCAM antibody in 5% milk. Relative intensity (rel. int.) vs. actin quantified by ImageJ software. A representative assay is shown (n = 3). (B) Boxplot representation of expression of indicated genes in X/c-myc liver tumors. ΔΔCt represents ΔCtnormal - ΔCttumor. ΔCt for all samples was calculated by subtracting Ct value of reference gene GAPDH from Ct values of gene of interest (*indicates p <0.05).
Fig. 6
Fig. 6. Expression of hCSC markers and pluripotency genes in HBV-related HCCs
(A) Heat map of gene-specific z-scores of HBV-related HCCs (T) relative to normal liver (N) revealed four distinct groups (I-IV). Samples 04T and 03T are outliers and were not assigned to a group. (B) Boxplot representation of expression of indicated genes in HBV-induced liver tumors of Groups I to IV. ΔΔCt represents ΔCtnormal - ΔCttumor. ΔCt for all samples was calculated by subtracting Ct value of reference gene GAPDH from Ct values of gene of interest (*indicates p <0.05).
Fig. 7
Fig. 7. Kaplan-Meier curves for overall survival analysis of patients with HBV-related HCCs
(A) Survival of patients from Group III vs. Rest, after surgical tumor resection (based on heatmap of Fig. 6A). Log-rank test assessed survivals (p = 0.07). (B) Expression of indicated genes in HCC subgroups (G1, G4-G6 and NT, non-tumor) described by Boyault et al. [41]. *p <0.06, **p <0.01. (C) Mutation status of CTNNB1 gene and expression level of GLUL, a marker of CTNNB1 tumors [44], in Group III tumors (n.a., not available). (D) Diagram of working model: in absence of HBV infection, PRC2 represses expression of its target genes. In HBV replicating cells, HBx activates PLK1 which phosphorylates SUZ12 leading to SUZ12 degradation [24]. However, marked downregulation of SUZ12 as shown in Fig. 4D, is associated with generation of a subpopulation of Wnt+ HBV replicating cells via EpCAM RIP, and re-expression of the hCSC-like gene signature. (This figure appears in colour on the web.)

Comment in

References

    1. Beasley RP, Hwang LY, Lin CC, Chien CS. Hepatocellular carcinoma and hepatitis B virus. A prospective study of 22,707 men in Taiwan. Lancet. 1981;2:1129–1133. - PubMed
    1. El-Serag HB, Rudolph KL. Hepatocellular carcinoma: epidemiology and molecular carcinogenesis. Gastroenterology. 2007;132:2557–2576. - PubMed
    1. Colombo M, Iavarone M. Role of antiviral treatment for HCC prevention. Best Pract Res Clin Gastroenterol. 2014;28:771–781. - PubMed
    1. Zoulim F, Locarnini S. Hepatitis B virus resistance to nucleos(t)ide analogues. Gastroenterology. 2009;137:1593–1608. e1591–e1592. - PubMed
    1. Llovet JM, Ricci S, Mazzaferro V, Hilgard P, Gane E, Blanc JF, et al. Sorafenib in advanced hepatocellular carcinoma. N Engl J Med. 2008;359:378–390. - PubMed

Substances