. 2016 Jun 15;90(6):1286-1298.
doi: 10.1016/j.neuron.2016.04.035. Epub 2016 May 26.

Inhibitory Input from the Lateral Hypothalamus to the Ventral Tegmental Area Disinhibits Dopamine Neurons and Promotes Behavioral Activation

Affiliations

Inhibitory Input from the Lateral Hypothalamus to the Ventral Tegmental Area Disinhibits Dopamine Neurons and Promotes Behavioral Activation

Edward H Nieh et al. Neuron. .

Abstract

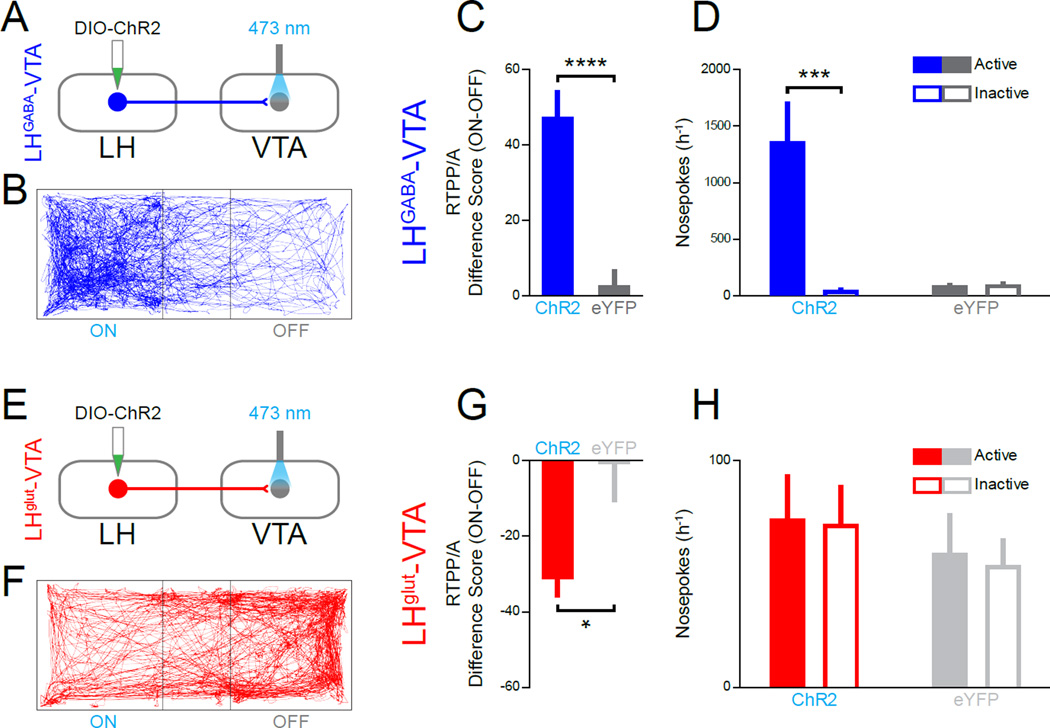
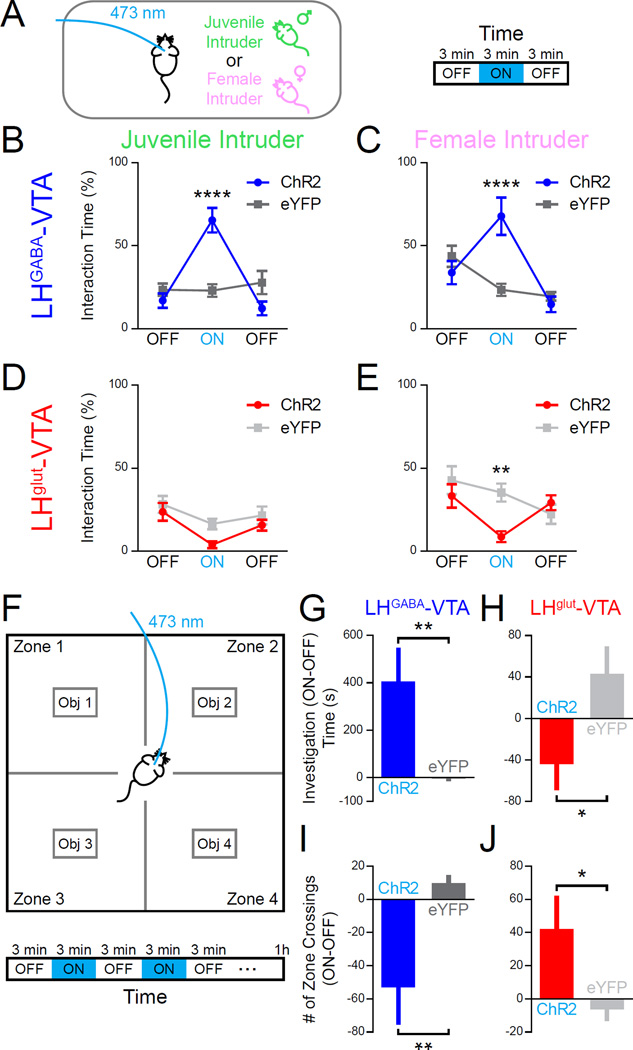
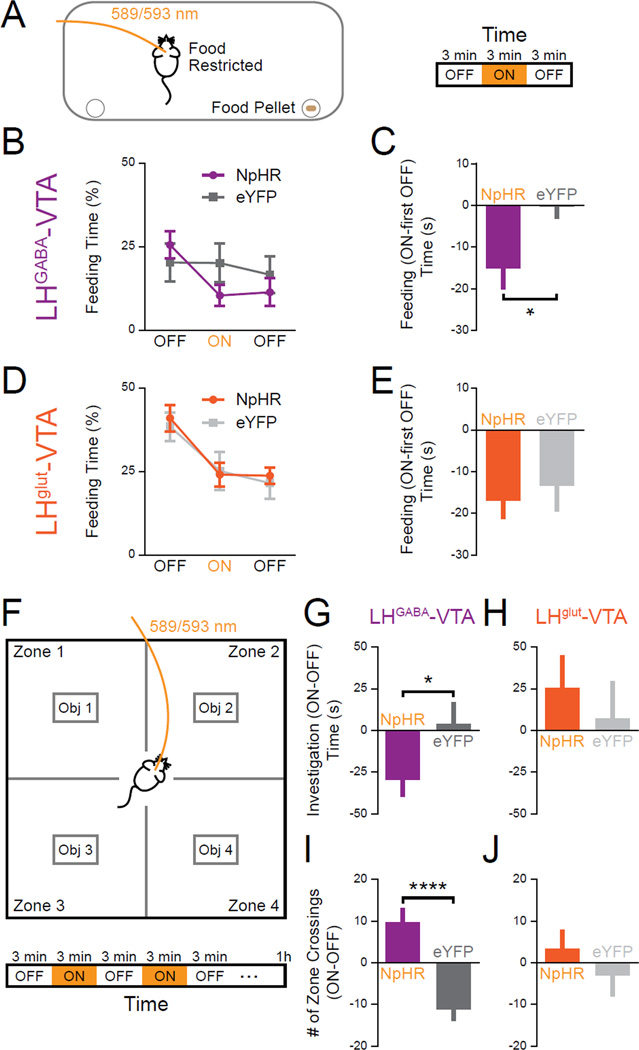
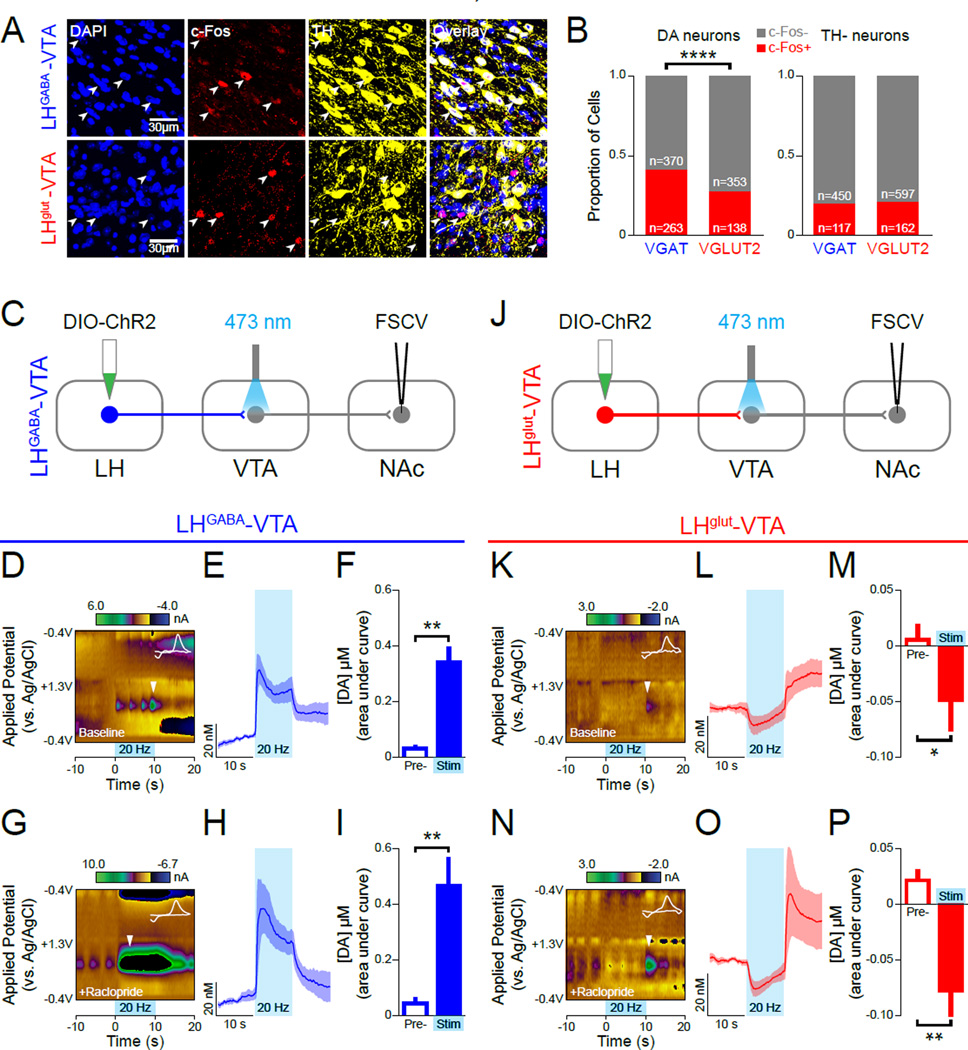
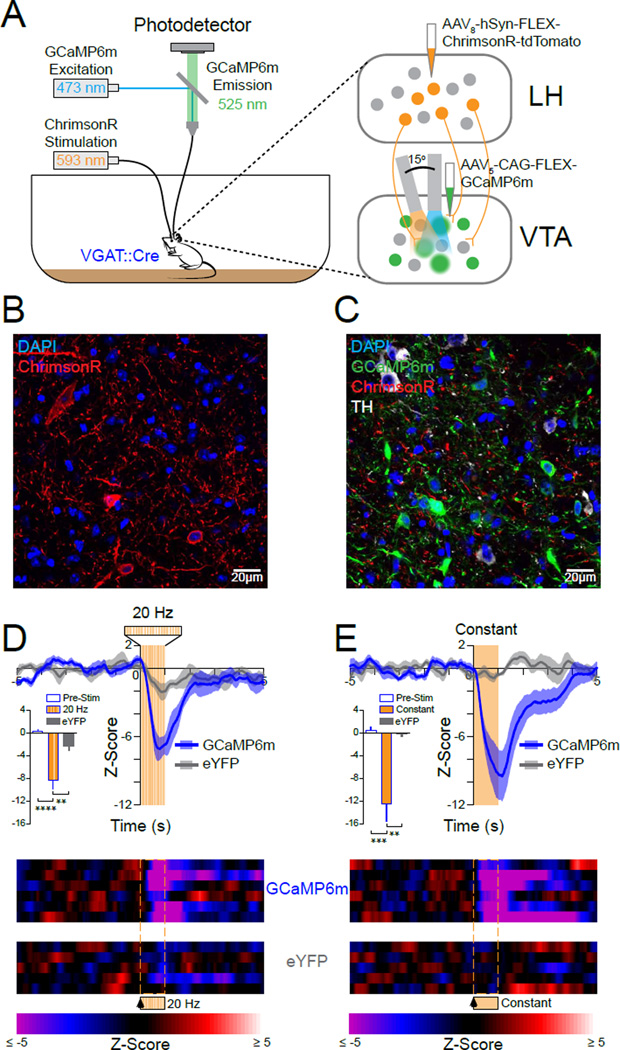
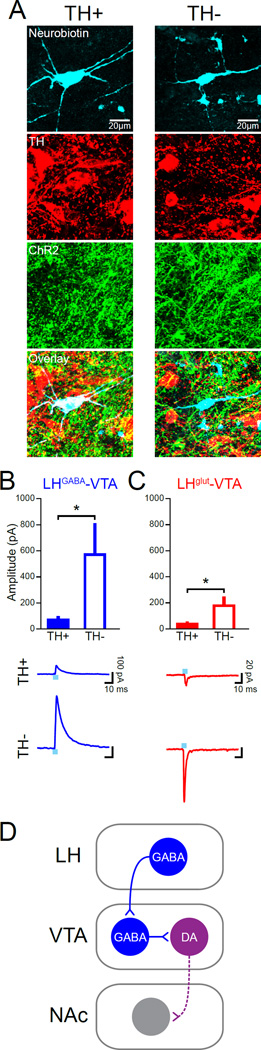
Projections from the lateral hypothalamus (LH) to the ventral tegmental area (VTA), containing both GABAergic and glutamatergic components, encode conditioned responses and control compulsive reward-seeking behavior. GABAergic neurons in the LH have been shown to mediate appetitive and feeding-related behaviors. Here we show that the GABAergic component of the LH-VTA pathway supports positive reinforcement and place preference, while the glutamatergic component mediates place avoidance. In addition, our results indicate that photoactivation of these projections modulates other behaviors, such as social interaction and perseverant investigation of a novel object. We provide evidence that photostimulation of the GABAergic LH-VTA component, but not the glutamatergic component, increases dopamine (DA) release in the nucleus accumbens (NAc) via inhibition of local VTA GABAergic neurons. Our study clarifies how GABAergic LH inputs to the VTA can contribute to generalized behavioral activation across multiple contexts, consistent with a role in increasing motivational salience. VIDEO ABSTRACT.


Figures

Figure 1
Figure 1. Photostimulation of the GABAergic LH-VTA Projection Promotes Approach, While Activation of the Glutamatergic LH-VTA Projection Promotes Avoidance
(A) VGAT∷Cre mice were injected with AAV5-DIO-ChR2-eYFP or AAV5-DIO-eYFP into the LH, and an optic fiber was implanted over the VTA. (B) Representative track from the real-time place preference/avoidance (RTPP/A) assay of an LHGABA-VTA:ChR2 mouse moving through an open chamber where one side was paired with blue light stimulation (473 nm, 10 Hz, 20 mW, 5 ms pulses). (C) LHGABA-VTA:ChR2 mice had a significantly greater difference score (percentage time spent in stimulation side minus percentage time spent in non-stimulation side) than LHGABA-VTA:eYFP mice (n=8 ChR2, n=10 eYFP; two-tailed, unpaired Student’s t-test, ****p<0.0001). (D) LHGABA-VTA:ChR2 mice made significantly more responses at the active nosepoke paired with blue light stimulation (473 nm, 10 Hz, 20 mW, 5 ms pulses, 1 s duration) than the inactive nosepoke as compared with eYFP controls (n=6 ChR2, n=8 eYFP; two-way ANOVA revealed a group x nosepoke interaction, F1,12=19.40, p=0.0009; Bonferroni post-hoc analysis, ***p<0.001). (E) VGLUT2∷Cre mice were injected with AAV5-DIO-ChR2-eYFP or AAV5-DIO-eYFP into the LH, and an optic fiber was implanted over the VTA. (F) Representative track from the RTPP/A assay of an LHglut-VTA:ChR2 mouse. (G) LHglut-VTA:ChR2 mice had a significantly lower difference score than LHglut-VTA:eYFP mice in the RTPP/A assay (n=7 ChR2, n=9 eYFP; two-tailed, unpaired Student’s t-test, *p=0.0175). (H) Optical stimulation did not have any significant effects on intracranial self-stimulation in LHglut-VTA:ChR2 compared with eYFP controls (n=7 ChR2, n=6 eYFP; two-way ANOVA: group x nosepoke interaction, F1,11=0.05, p=0.8307). Error bars indicate ±SEM. See also Figures S1 and S2.
Figure 2
Figure 2. Photostimulation of the GABAergic LH-VTA Projection Promotes Social Interaction and Object Investigation, while Photostimulation of the Glutamatergic LH-VTA Projection Suppresses These Behaviors
(A) To assess social interaction, mice were placed into a cage with a novel juvenile male or an adult female intruder. Time spent interacting was quantified for three consecutive three-minute epochs, with the second epoch paired with blue light stimulation (473 nm, 20 Hz, 20 mW, 5 ms pulses). (B) LHGABA-VTA:ChR2 mice showed increased time spent interacting with juvenile male intruders compared with LHGABA-VTA:eYFP controls during the ON epoch (n=10 ChR2, n=11 eYFP; two-way ANOVA revealed a group x epoch interaction, F2,38=23.62, p<0.0001; Bonferroni post-hoc analysis, ****p < 0.0001), (C) as well as with female intruders (n=11 ChR2, n=10 eYFP; two-way ANOVA revealed a group x epoch interaction, F2,38=10.05, p=0.0003; Bonferroni post-hoc analysis, ****p<0.0001). (D) LHglut-VTA:ChR2 mice did not show a significant difference in time spent interacting with juvenile male intruders compared with LHglut-VTA:eYFP mice, likely due to a strong epoch effect (n=8 ChR2, n=12 eYFP; two-way ANOVA revealed a significant epoch effect, F2,36=10.05, p=0.0003), (E) but did show a significant decrease in interaction during the ON epoch with female intruders (n=7 ChR2, n=6 eYFP; two-way ANOVA revealed a group x epoch interaction, F2,22=7.45, p=0.0034; Bonferroni post-hoc analysis, **p<0.01). (F) In order to examine the effects of GABAergic and glutamatergic LH-VTA stimulation on motivational salience, mice were placed into an open field chamber with four zones, each containing a novel object. Mice were allowed to freely explore the chamber for one hour while receiving blue light stimulation (473 nm, 20 Hz, 20 mW, 5 ms pulses) for three-minute epochs at three-minute intervals. (G) LHGABA-VTA:ChR2 mice had a significantly greater difference score in time spent investigating the novel objects (ON-OFF) than their eYFP counterparts (n=7 ChR2, n=8 eYFP; two-tailed, unpaired Student’s t-test, **p=0.0070), while (H) LHglut-VTA:ChR2 mice had a significantly lower difference score than their respective eYFP counterparts (n=8 ChR2, n=7 eYFP; two-tailed, unpaired Student’s t-test, *p=0.0250). (I) LHGABA-VTA:ChR2 mice had a significantly lower difference score for the number of zone crossings (ON-OFF) than their eYFP counterparts (n=7 ChR2, n=8 eYFP; two-tailed, unpaired Student’s t-test, **p=0.0080), while (J) LHglut-VTA:ChR2 mice had a significantly higher difference score (n=8 ChR2, n=7 eYFP; two-tailed, unpaired Student’s t-test, *p=0.0372) than their respective eYFP counterparts. Error bars indicate ±SEM. See also Figures S1 and S2.
Figure 3
Figure 3. Inhibition of the GABAergic LH-VTA Projection of Animals in a Motivated State Suppresses Behavioral Responding
(A) Food-restricted mice were placed into an empty chamber with two cups, one of which held a moist food pellet, while the other was empty. Time spent feeding was quantified for three consecutive three-minute epochs, with the second epoch paired with yellow light stimulation (589/593 nm, constant, 5 mW). (B) There was a significant interaction of light stimulation on time spent feeding in LHGABA-VTA:NpHR mice relative to eYFP controls (n=8 NpHR, n=9 eYFP; two-way ANOVA revealed a group x epoch interaction, F2,30=4.46, p=0.0202). (C) In addition, LHGABA-VTA:NpHR mice had a significantly lower difference score in time spent feeding (ON-first OFF) when compared with eYFP controls (n=8 NpHR, n=9 eYFP; two-tailed, unpaired Student’s t-test, *p=0.0210). (D) Meanwhile, no effect was found in LHglut-VTA:NpHR mice and their controls on the amount of time spent feeding (n=10 NpHR, n=7 eYFP; two-way ANOVA: group x epoch interaction, F2,30=0.17, p=0.8484), or (E) in difference score (n=10 NpHR, n=7 eYFP; two-tailed, unpaired Student’s t-test, p=0.5963). (F) In the four-chamber novel object test, (G) LHGABA-VTA:NpHR mice had a significantly lower difference score in investigation time (ON-OFF) than eYFP controls (n=7 NpHR, n=8 eYFP; two-tailed, unpaired Student’s t-test, *p=0.0305), while (H) LHglut-VTA:NpHR mice showed no differences from their eYFP controls (n=10 NpHR, n=7 eYFP; two-tailed, unpaired Student’s t-test, p=0.5358). (I) LHGABA-VTA:NpHR mice also had a significantly greater difference score in the number of zone crossings (ON-OFF) than eYFP controls (n=8 NpHR, n=8 eYFP; two-tailed, unpaired Student’s t-test, ****p<0.0001), while (J) LHglut-VTA:NpHR mice showed no differences from their eYFP controls (n=10 NpHR, n=7 eYFP; two-tailed, unpaired Student’s t-test, p=0.3247). Error bars indicate ±SEM. See also Figures S2 and S3.
Figure 4
Figure 4. Optogenetic Activation of the GABAergic LH-VTA Projection Increases, while Activation of the Glutamatergic LH-VTA Projection Suppresses, Dopamine Release in the NAc
(A) Representative confocal images from the VTA of LHGABA-VTA:ChR2 (top) and LHglut-VTA:ChR2 (bottom) mice showing c-Fos+ (red) and TH+ (yellow) neurons in the VTA after photostimulation (473 nm, 20 Hz, 20 mW, 5 ms pulses, 10 min duration). (B) Proportion of DA (TH+) neurons (left) and TH- neurons (right) that either co-express or do not co-express c-Fos after LHGABA-VTA or LHglut-VTA photostimulation. Mice receiving LHGABA-VTA stimulation showed a significantly greater proportion of cells co-expressing TH and c-Fos compared with mice receiving LHglut-VTA stimulation (Chi-square=21.77, ****p<0.0001). (C) VGAT∷Cre mice were injected with AAV5-DIO-ChR2-eYFP into the LH, and an optic fiber was implanted over the VTA. Anesthetized fast-scan cyclic voltammetry (FSCV) recordings were obtained from the nucleus accumbens (NAc). (D, E, F) Optical activation of the LHGABA-VTA projection evoked DA release in the NAc. (D) Representative false color plot showing an increase in current at the oxidation potential for DA (∼0.65 V) upon LHGABA-VTA photostimulation (473 nm, 20 Hz, 20 mW, 5 ms pulses, 10 s duration), (E) which is also evident in the averaged population data after conversion into DA concentration. (F) Quantification of extracellular DA concentration ([DA]) as area under the curve showed that LHGABA-VTA stimulation caused a significant increase in DA release in the NAc (compared with pre-stimulation; n=6 mice; two-tailed, paired Student’s t-test, **p=0.0013). (G, H, I) Under D2 receptor blockade (intraperitoneal (IP) raclopride), LHGABA-VTA stimulation also increased NAc DA neurotransmission (G) as seen in the representative color plot (H) and averaged population data. (I) Quantification of [DA] as area under the curve revealed a significant increase in DA release under D2 receptor blockade (n=6 mice; two-tailed, paired Student’s t-test, **p=0.0037). (J) VGLUT2∷Cre mice were prepared for FSCV as described above for VGAT∷Cre mice. (K, L, M) LHglut-VTA stimulation caused a pause in NAc DA release under resting, baseline conditions. (K) Representative false color plot showing a decrease in current at the oxidation potential for DA in response to LHglut-VTA stimulation (473 nm, 20 Hz, 20 mW, 5 ms pulses, 10 s duration). Stimulation offset was accompanied by a “rebound” DA transient, likely caused by rebound firing following hyperpolarization of VTA DA neurons during stimulation, which was also observed in the (L) averaged population data after conversion to [DA]. (M) Quantification of [DA] as area under the curve showed that LHglut-VTA stimulation caused a significant decrease in [DA] in the NAc under resting conditions (n=5 mice; two-tailed, paired Student’s t-test, *p=0.0325). (N, O, P) Under the influence of raclopride, LHglut-VTA activation robustly inhibited NAc DA release observed in the (N) representative color plot and (O) population average. (P) Quantification of [DA] showed that LHglut-VTA activation caused a significant and robust decrease in [DA] under D2 receptor blockade (n=6 mice; two-tailed, paired Student’s t-test, **p=0.0089). Color plot insets: cyclic voltammograms (CVs) at time-points indicated by the inverted white triangles. Error bars indicate ±SEM. See also Figure S4.
Figure 5
Figure 5. GABAergic LH Inputs Inhibit GABA Neurons in the VTA
(A) In order to activate GABAergic LH-VTA projections and record from GABA neurons in the VTA simultaneously, VGAT∷Cre mice were injected with AAV8-hSyn-FLEX-ChrimsonR-tdTomato into the LH and AAV5-CAG-FLEX-GCaMP6m into the VTA with two optic fibers implanted over the VTA. (B) Confocal image showing ChrimsonR+ cells bodies in the LH (red). (C) Confocal image showing GCaMP6m+ cell bodies in the VTA (green), ChrimsonR+ fibers (red), and TH+ neurons (white). (D) 20 Hz LHGABA-VTA photostimulation (593 nm, 5–10 mW, 5 ms pulses, 1 s duration) caused a decrease in GCaMP6m fluorescence in VTA GABA neurons, as seen in both population averages for Z-Scores as well as individual heat maps, indicating a decrease in neural activity of VTA GABA neurons. Inset bar graph: the quantification of the area under the curve for stimulation (0–2 s), compared with pre-stimulation (−2–0 s) and eYFP controls (0–2 s) showed that 20 Hz stimulation (593 nm, 5–10 mW, 1 s duration) caused a significant decrease in VTA GABA neural activity (n=6 GCaMP6m, n=5 eYFP; one-way ANOVA, F2,14=24.39, ****p<0.0001, Bonferroni post-hoc analysis, **p<0.01, ****p<0.0001) (E) Photostimulation of the LHGABA-VTA projection with constant light (593 nm, 5–10 mW, 1 s duration) also caused a significant decrease in GABA neural activity. Inset bar graph (n=6 GCaMP6m, n=5 eYFP; one-way ANOVA, F2,14=15.75, ***p=0.0003, Bonferroni post-hoc analysis, **p<0.01, ***p<0.001). Error bars indicate ±SEM.
Figure 6
Figure 6. GABAergic and Glutamatergic LH Projections are Stronger onto Putative GABA Neurons than Dopamine Neurons in the VTA
(A) Whole-cell patch-clamp recordings were made from VTA neurons in brain slices prepared from VGAT∷Cre and VGLUT2∷Cre mice expressing ChR2 in a Cre-dependent manner in the LH. Neurons were filled with neurobiotin during recording and subsequently processed with immunohistochemistry for TH (red). (B) ChR2-expressing terminals were activated with a 5 ms blue light pulse to elicit inhibitory post-synaptic currents (IPSCs) in VGAT∷Cre mice. IPSC amplitude was significantly greater in TH-VTA cells than TH+ cells (n=9 TH+, n=7 TH-; two-tailed, unpaired Student’s t-test, *p=0.0270). (C) Similarly, in VGLUT2∷Cre mice, the amplitude of optically-evoked excitatory post-synaptic currents (EPSCs) was significantly greater in TH- VTA cells than TH+ cells (n=5 TH+, n=5 TH-; two-tailed, unpaired Student’s t-test, *p=0.0464). (D) Model representing the GABAergic projection from the LH onto GABA cells in the VTA. Activation of the GABAergic LH-VTA projection results in disinhibition of VTA DA neurons and therefore increases DA release in the NAc. Error bars indicate ±SEM. See also Figure S5.

References

    1. Albert DJ, Nanji N, Brayley KN, Madryga FJ. Hyperreactivity as well as mouse killing is induced by electrical stimulation of the lateral hypothalamus in the rat. Behav. Neural Biol. 1979;27:59–71. - PubMed
    1. Anand BK, Brobeck JR. Localization of a “feeding center” in the hypothalamus of the rat. Proc. Soc. Exp. Biol. Med. Soc. Exp. Biol. Med. N. Y. 1951;77:323–324. - PubMed
    1. Andersson JL, Nomikos GG, Marcus M, Hertel P, Mathe JM, Svensson TH. Ritanserin potentiates the stimulatory effects of raclopride on neuronal activity and dopamine release selectively in the mesolimbic dopaminergic system. Naunyn. Schmiedebergs Arch. Pharmacol. 1995;352:374–385. - PubMed
    1. Aragona BJ, Cleaveland NA, Stuber GD, Day JJ, Carelli RM, Wightman RM. Preferential Enhancement of Dopamine Transmission within the Nucleus Accumbens Shell by Cocaine Is Attributable to a Direct Increase in Phasic Dopamine Release Events. J. Neurosci. 2008;28:8821–8831. - PMC - PubMed
    1. Barbano MF, Wang H-L, Morales M, Wise RA. Feeding and Reward Are Differentially Induced by Activating GABAergic Lateral Hypothalamic Projections to VTA. J. Neurosci. Off. J. Soc. Neurosci. 2016;36:2975–2985. - PMC - PubMed

Publication types

LinkOut - more resources