Randomized Controlled Trial
. 2016 Jun 7;15(10):2136-2146.
doi: 10.1016/j.celrep.2016.05.009. Epub 2016 May 26.

A Diet Mimicking Fasting Promotes Regeneration and Reduces Autoimmunity and Multiple Sclerosis Symptoms

Affiliations
Randomized Controlled Trial

A Diet Mimicking Fasting Promotes Regeneration and Reduces Autoimmunity and Multiple Sclerosis Symptoms

In Young Choi et al. Cell Rep. .

Abstract

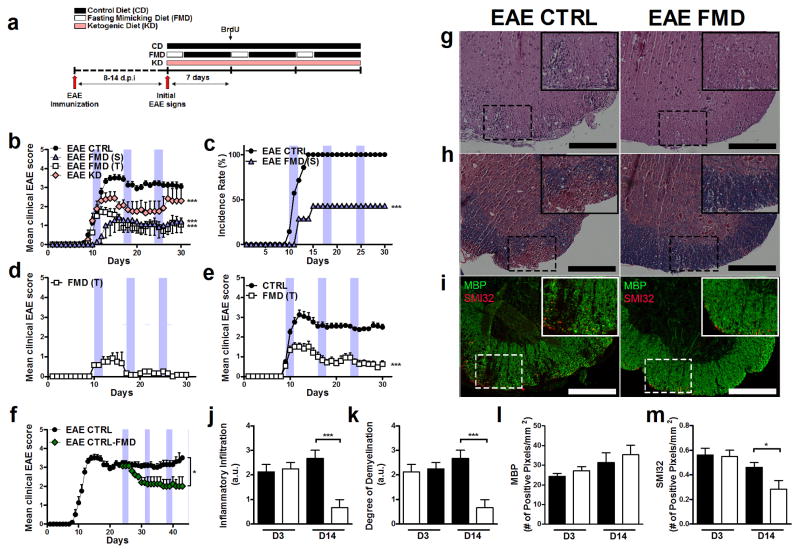
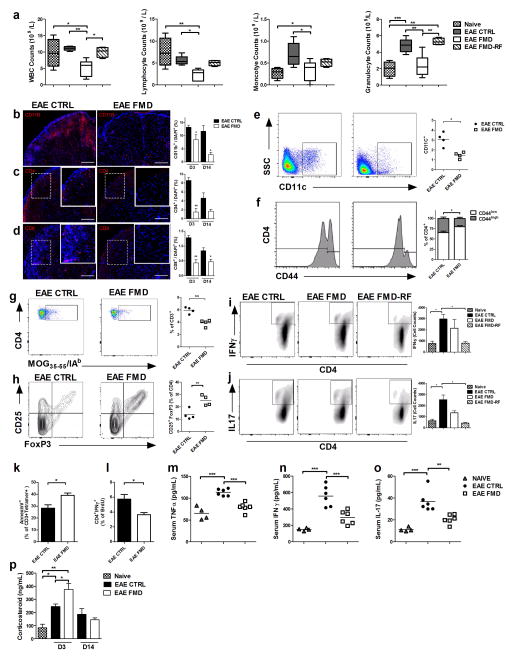
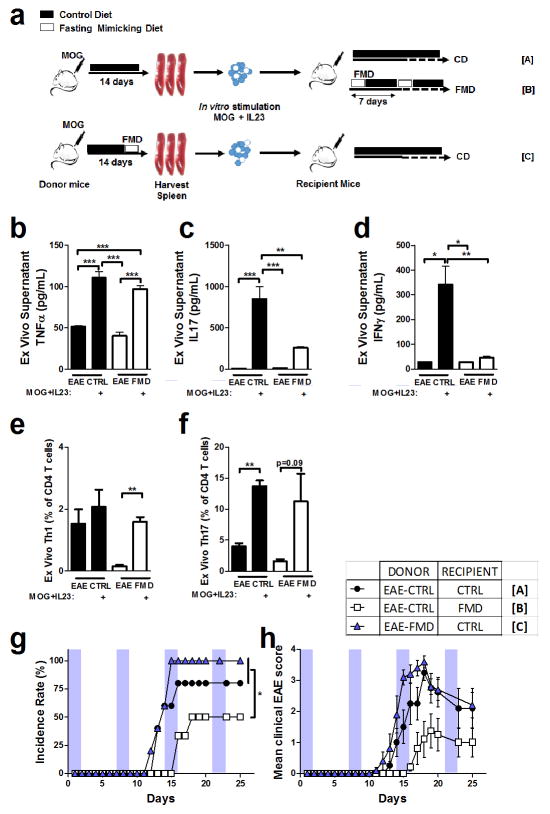
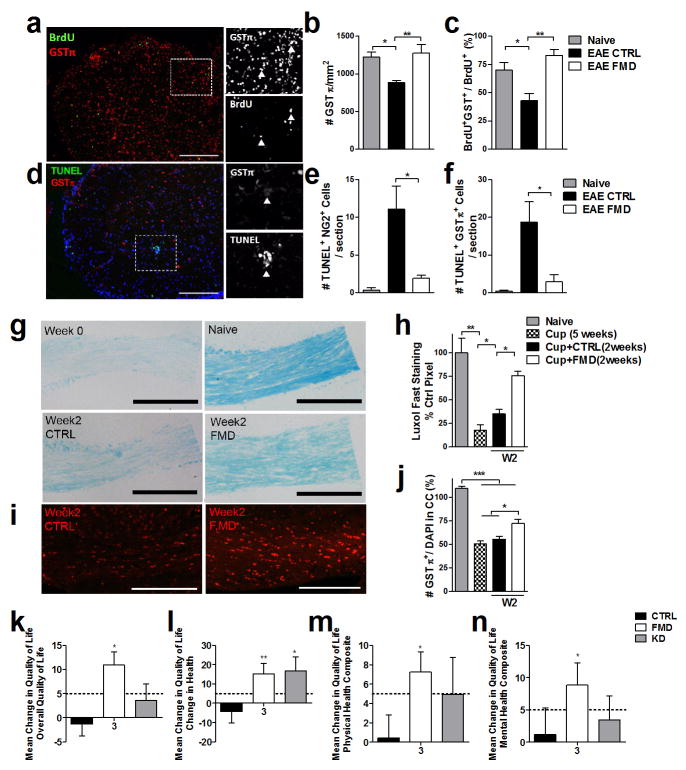
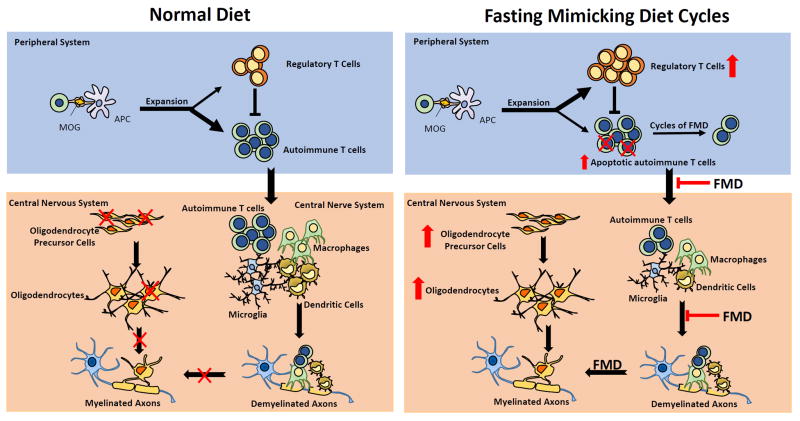
Dietary interventions have not been effective in the treatment of multiple sclerosis (MS). Here, we show that periodic 3-day cycles of a fasting mimicking diet (FMD) are effective in ameliorating demyelination and symptoms in a murine experimental autoimmune encephalomyelitis (EAE) model. The FMD reduced clinical severity in all mice and completely reversed symptoms in 20% of animals. These improvements were associated with increased corticosterone levels and regulatory T (Treg) cell numbers and reduced levels of pro-inflammatory cytokines, TH1 and TH17 cells, and antigen-presenting cells (APCs). Moreover, the FMD promoted oligodendrocyte precursor cell regeneration and remyelination in axons in both EAE and cuprizone MS models, supporting its effects on both suppression of autoimmunity and remyelination. We also report preliminary data suggesting that an FMD or a chronic ketogenic diet are safe, feasible, and potentially effective in the treatment of relapsing-remitting multiple sclerosis (RRMS) patients (NCT01538355).


Figures

Figure 1
Figure 1. FMD cycles decrease disease severity of the MOG35-55-induced EAE model
(mean ± S.E.M, * p < 0.05, ** p<0.01; *** p < 0.001; t test, 1-way or 2-way ANOVA & Bonferroni Post Test; Scale bar represents 200 μm). a. Diagram displaying the time course of the immunization and the diet interventions. b. The EAE severity scoresof the Control Diet (EAE CTRL; n=23), ketogenic diet (EAE KD); n=13, semi-therapeutic FMD cycles (EAE FMD(S); n=7) or therapeutic FMD cycles (FMD(T); n = 23). c. Incidence rate of the EAE CTRL and EAE FMD (S) (n=7–23). d. EAE severity score of the EAE FMD(T) mice that completely reversed the EAE severity and scored 0, no observable disease (n=5). e. EAE severity score of the best-performing control mice (n=12) and the FMD(T) mice (n=12). f. EAE severity score of the EAE CTRL mice that treated with FMD upon chronic EAE development(EAE CTRL-FMD) (n=6). g–m. Spinal cord of the EAE CTRL and the EAE FMD (T) mice with quantification of (g) H&E staining, (h) solochrome cyanine staining, and (i) MBP (Myelin Basic Protein) and SMI32 staining of spinal cord sections isolated at day 14.
Figure 2
Figure 2. FMD cycles decrease the number of infiltrating T cells in the Spinal Cord
(n=4–8 / group; mean ± S.E.M, * p < 0.05, ** p<0.01; *** p < 0.001; t test, 1-way ANOVA & Bonferroni Post Test; Scale bar represents 200 μm). a. Total white blood cells (WBC), lymphocytes, monocytes and granulocyte counts of the naïve, EAE-CTRL, EAE-FMD, and after 3 days of the re-feeding (EAE-FMD: RF) mice after 3 cycles of the FMD and matched time point for the EAE-CTRL. b–d. Spinal cord sections (D14) and quantification at D3 and D14 post the first EAE sign for (b)CD11b+, (c) CD4+, and (d) CD8+ (at least 6 sections / mouse). e. CD11c+ isolated from the EAE CTRL or EAE FMD mice on D3 and the quantification of cells from the total isolated splenocyte. f. CD4+ gated for CD44L or CD44H isolated from the EAE CTRL or EAE FMD and quantification of % splenocyte of CD4+ CD44L (Inactive) or CD4+ CD44H (Active) cells. g. CD3+ lymphocytes gated for CD4 and MOG35-55/IAb from EAE CTRL or EAE FMD and quantification of the MOG specific CD4+ cells. h. CD4+ CD25+ FoxP3+ isolated from EAE CTRL or EAE FMD and the quantification of CD25+ FoxP3+ of CD4+ cells. i–j. Intracellular staining for either IFNγ (i) or IL17(j) after gated for CD4+ of the naïve, EAE CTRL, EAE FMD, EAE FMD:RF and quantification of cell counts. k. Quantification of Annex in V+ apoptotic CD3+ MOG35-55/IAb cells. l. Quantification of CD4+IFNγ+ of BrdU+ lymphocytes. m–o. Serum (m)TNFα, (n)IFNγ, and (o)IL-17 level (pg/mL) of the naive, EAE CTRL and EAE FMD mice on D3 post first sign of EAE. p. Serum corticosterone level (ng/mL) of before immunization, at the time of the symptom, 3 or 14 days after initial symptom of the control or FMD.
Figure 3
Figure 3. Antigen activated splenocytes from the EAE-CTRL and the EAE-FMD mice had similar encephalitogenic effects
(n=5–6 / group; mean ± S.E.M, * p < 0.05, ** p<0.01; *** p < 0.001; t test, 1-way ANOVA & Bonferroni Post Test). a. Diagram for the adoptive transfer EAE model. b–d. Quantification of the (b) TNFα, (c) IFNγ, and (d)IL-17 (pg/mL) of the supernatant from ex-vivo culture of splenocytes from naïve, EAE CTRL, and EAE FMD either with or without MOG35-55 and IL-23 re-activation e–f. Quantification of TH1 or TH17 (represented by % of CD4+) from lymphocytes culture of EAE CTRL and EAE FMD with or without MOG35-55 and IL-23 re-activation g. Incidence rate of adoptive transfer EAE groups. h. EAE severity score of adoptive transfer EAE groups.
Figure 4
Figure 4. The FMD cycles protect the spinal cord from loss of oligodendrocyte precursor cells and oligodendrocytes and enhances remyelination in the cuprizone model
(At least 12 sections/ mouse were used for quantification; n=4; mean ± S.E.M, * p < 0.05, ** p<0.01; *** p < 0.001; 1-way ANOVA & Bonferroni Post Test). a – c. Spinal cord sections isolated at Day 14 and quantification for (a) GST-π (mature oligodendrocyte) and BrdU, for (b) TUNEL and NG2 (oligodendrocyte precursor cells), and for (c) TUNEL and GST-π of the naive, EAE-CTRL or EAE-FMD. f–h. Sections from the corpus callosum region and quantification of cuprizone treated brains, stained with Luxol Fast Blue of the naïve control, end of 5 weeks of cuprizone diet (week 0), cuprizone (5 weeks) + regular chow (2 weeks), cuprzione (5 weeks) + FMD cycle (2 weeks). i–j. Section from the corpus callosum region and its quantification of the cuprizone treated brains stained with GST-π+ of cuprizone (5 weeks) + regular chow (2 weeks), cuprzione (5 weeks) + FMD (2 weeks). Quantification is normalized to % of the naïve GST-π+ level. k–m. Change in the quality of life at 3 month of (k) overall quality of life, (l) change in health, (m) physical health composite, and (n) mental health composite. The dotted line represents a threshold that is thought to be clinically important (≥ 5 points) (mean ± SED; * p<0.05; Mann-Whitney-U test. Increase of ≥ 5 points are considered as clinically important).
Figure 5
Figure 5. A simplified model of FMD-mediated effects on glucocorticoid, immune suppression & oligodendrocyte regeneration and differentiation in MS
The FMD treatment promotes endogenous glucocorticoid production, increases Treg cell numbers, blocks T-cell activation and promotes T-cell death. In the lesion area. FMD treatment reduces autoimmune T-cell and microglia infiltration, promotes oligodendrocyte precursor dependent regeneration and the differentiation of myelinating oligodendrocyte which engage with demyelinated axons to promote the formation of myelin sheaths.

References

    1. Ashwell JD, Lu FW, Vacchio MS. Glucocorticoids in T cell development and function*. Annual review of immunology. 2000;18:309–345. - PubMed
    1. Brandhorst S, Choi IY, Wei M, Cheng CW, Sedrakyan S, Navarrete G, Dubeau L, Yap LP, Park R, Vinciguerra M, et al. A Periodic Diet that Mimics Fasting Promotes Multi-System Regeneration, Enhanced Cognitive Performance, and Healthspan. Cell metabolism. 2015;22:86–99. - PMC - PubMed
    1. Brusaferri F, Candelise L. Steroids for multiple sclerosis and optic neuritis: a meta-analysis of randomized controlled clinical trials. Journal of neurology. 2000;247:435–442. - PubMed
    1. Ce P, Gedizlioglu M, Gelal F, Coban P, Ozbek G. Avascular necrosis of the bones: an overlooked complication of pulse steroid treatment of multiple sclerosis. European journal of neurology : the official journal of the European Federation of Neurological Societies. 2006;13:857–861. - PubMed
    1. Chang A, Tourtellotte WW, Rudick R, Trapp BD. Premyelinating oligodendrocytes in chronic lesions of multiple sclerosis. The New England journal of medicine. 2002;346:165–173. - PubMed

Publication types

MeSH terms

Substances

Associated data