. 2016:2016:8416237.
doi: 10.1155/2016/8416237. Epub 2016 Apr 27.

A Framework for the Comparative Assessment of Neuronal Spike Sorting Algorithms towards More Accurate Off-Line and On-Line Microelectrode Arrays Data Analysis

Affiliations

A Framework for the Comparative Assessment of Neuronal Spike Sorting Algorithms towards More Accurate Off-Line and On-Line Microelectrode Arrays Data Analysis

Giulia Regalia et al. Comput Intell Neurosci. 2016.

Abstract

Neuronal spike sorting algorithms are designed to retrieve neuronal network activity on a single-cell level from extracellular multiunit recordings with Microelectrode Arrays (MEAs). In typical analysis of MEA data, one spike sorting algorithm is applied indiscriminately to all electrode signals. However, this approach neglects the dependency of algorithms' performances on the neuronal signals properties at each channel, which require data-centric methods. Moreover, sorting is commonly performed off-line, which is time and memory consuming and prevents researchers from having an immediate glance at ongoing experiments. The aim of this work is to provide a versatile framework to support the evaluation and comparison of different spike classification algorithms suitable for both off-line and on-line analysis. We incorporated different spike sorting "building blocks" into a Matlab-based software, including 4 feature extraction methods, 3 feature clustering methods, and 1 template matching classifier. The framework was validated by applying different algorithms on simulated and real signals from neuronal cultures coupled to MEAs. Moreover, the system has been proven effective in running on-line analysis on a standard desktop computer, after the selection of the most suitable sorting methods. This work provides a useful and versatile instrument for a supported comparison of different options for spike sorting towards more accurate off-line and on-line MEA data analysis.


Figures

Figure 1
Figure 1
Scheme of the spike sorting processing algorithms incorporated in this work. For each electrode the raw signal is preprocessed before the subsequent spike detection by a threshold-based algorithm (i.e., AdaBandFlt [24]). The feature extraction can be performed with four different methods (i.e., principal component analysis (PCA), Discrete Wavelet Transform (DWT), geometric features (GEO), and First and Second Derivative Extrema (FSDE)) followed by a dimensionality reduction step that retains the relevant features. Three clustering algorithms are implemented to automatically cluster spike features (i.e., K-means, fuzzy-C-means (FCM), and density-based clustering (DBC)). As an alternative, a template matching algorithm (O-sort) groups the spikes as soon as they are detected.
Figure 2
Figure 2
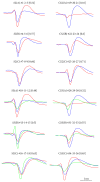
Features of the simulated data set. Spike waveforms were selected from a database of averaged spike waveforms obtained from spontaneous activity recorded in hippocampal and cortical in vitro neuronal networks by MEA. For each group of waveforms depicted in the figure, signals with three different SNR (4, 3, and 2) were simulated, obtaining a total of 36 signals. Each set of waveforms is associated with an ID name (e.g., S2(A)), the ordinal position in the data set (e.g., #1-2-3), and the mean Bray-Curtis similarity (BCS) between the waveforms (e.g., [0.52]).
Figure 3
Figure 3
Performance assessment flow. (a) Scheme of the performance assessment procedure employed to evaluate the simulated data set in presence of “ground truth,” obtaining the cluster validity index and the classification accuracy. (b) Scheme of the performance assessment procedure employed to evaluate the set of real signals without a “ground truth,” obtaining the intracluster variance and parameters judged by visual inspection.
Figure 4
Figure 4
Structure and functionalities of the graphical user interface. Structure and functionalities of the GUI, which is composed of a “test data” section (intended for the analysis of simulated signals) and a “real data” section that can be used for either off-line or on-line analysis.
Figure 5
Figure 5
Graphical user interface. (a) Screenshot of the GUI built for spike sorting on simulated data. (b) Example of graphical result of spike sorting on multichannel MEA signals, representing the clustered spike waveforms for each electrode of the matrix. (c) Example of graphical result of spike sorting on multichannel MEA signals, representing the spike trains collected by each electrode, with spikes colored according to the signal source.
Figure 6
Figure 6
Comparison of the separability of simulated spikes in the feature space. (a) Example of projections of the spikes extracted from a simulated signal (i.e., signal #10 of Figure 2) in each feature space (PCA: Principal Components Analysis, DWT: Discrete Wavelet Transform, GEO: geometric features, and FSDE: First and Second Derivative Extrema), colored according to the real labels. (b) Cluster validity (CV) values obtained after the application of the 4 feature extraction methods to the 36 simulated extracellular signals. (c) Cluster validity dependence on different noise levels (median of CV values for each SNR group). (d) Box-plots (median and IQR with whiskers delimited by the maximum and minimum nonoutliers values) of CV values on all the simulated signals (N = 36). The asterisks above each method indicate statistically highest CV values of the current method compared to the method(s) coded by the asterisks' color (Wilcoxon's matched pair test with p < 0.01).
Figure 7
Figure 7
Comparison of classification accuracy on the simulate data sets with the benchmark K-means method. (a) Example of projections of the same data set (i.e., number 10 of Figure 2) in each FE space and results of K-means clustering of the features. Spikes are colored according to the real label. Superimposed circles are the clusters found by K-means. (b) Classification accuracy values for the 36 simulated signals.
Figure 8
Figure 8
Classification accuracy on the simulated data sets. (a) Indication of which method yielded the highest classification accuracy (CA) for each data set (marked by the red box). (b) Box-plots (median and IQR with whiskers delimited by the maximum and minimum nonoutliers values) of classification accuracy provided by all the methods on all the data sets (N = 36). The statistically significant differences are indicated as the numbers above each box-plot, the box-plot being marked with “1” referring to the method with highest CA compared to all the others and the box-plot marked with “8” referred to the method with the lowest CA compared to all the others (Friedman's test followed by Wilcoxon's matched pair test, p < 0.01).
Figure 9
Figure 9
Performances of the methods on real data. (a) Outcome of the visual inspection on the results of the methods, where the percentage of nonclassified spikes and the ratio between the number of correctly identified clusters and the real number of clusters are reported. Each symbol represents a combination of algorithms, as indicated by the legend and annotations in the graph. K-means is not represented since it does not provide unclassified spikes. (b) Box-plots (median and IQR with whiskers delimited by the maximum and minimum nonoutliers values) of the intracluster variance (ICV) for each of the FE and clustering combinations and O-sort applied to all the real signals (N = 10). The statistically significant differences are indicated as the numbers above each box-plot, the box-plot being marked with “1” referring to the methods with lowest ICV compared to all the others and the box-plot marked with “4” referred to the methods with highest ICV compared to all the others (Friedman's test followed by Wilcoxon's matched pair test, p < 0.01).
Figure 10
Figure 10
Evaluation of runtimes of the spike sorting algorithms. Runtimes measured in the experimental setup, for different lengths of input data block (ms) sent from the acquisition device to Matlab. Runtimes were measured in a worst-case scenario of high firing activity simultaneously occurring at all the 64 channels. Values related to raw data reading, filtering, spike detection, and classification with all the possible methods are reported. The runtime is related to input data block length (i.e., the time available for processing before the buffer update) and is expressed as its percentage (e.g., a runtime percentage equal to 60% for a 1 second block means that there is a margin of 400 ms for further operations). Times are for Matlab running on a quad-core 3.3 GHz CPUs desktop computer with 4 GB RAM and Windows 7 64-bit.

Similar articles

Cited by

References

    1. Johnstone A. F. M., Gross G. W., Weiss D. G., Schroeder O. H.-U., Gramowski A., Shafer T. J. Microelectrode arrays: a physiologically based neurotoxicity testing platform for the 21st century. NeuroToxicology. 2010;31(4):331–350. doi: 10.1016/j.neuro.2010.04.001. - DOI - PubMed
    1. Spira M. E., Hai A. Multi-electrode array technologies for neuroscience and cardiology. Nature Nanotechnology. 2013;8:83–94. doi: 10.1038/nnano.2012.265. - DOI - PubMed
    1. Liu M.-G., Chen X.-F., He T., Li Z., Chen J. Use of multi-electrode array recordings in studies of network synaptic plasticity in both time and space. Neuroscience Bulletin. 2012;28(4):409–422. doi: 10.1007/s12264-012-1251-5. - DOI - PMC - PubMed
    1. Bestel R., Daus A. W., Thielemann C. A novel automated spike sorting algorithm with adaptable feature extraction. Journal of Neuroscience Methods. 2012;211(1):168–178. doi: 10.1016/j.jneumeth.2012.08.015. - DOI - PubMed
    1. Gibson S., Judy J. W., Marković D. Spike sorting: the first step in decoding the brain: the first step in decoding the brain. IEEE Signal Processing Magazine. 2012;29(1):124–143. doi: 10.1109/msp.2011.941880. - DOI

LinkOut - more resources