. 2016 Feb 27;6(4):251-63.
doi: 10.1002/2211-5463.12027. eCollection 2016 Apr.

miRNA expression profiling of Epstein-Barr virus-associated NKTL cell lines by Illumina deep sequencing

Affiliations

miRNA expression profiling of Epstein-Barr virus-associated NKTL cell lines by Illumina deep sequencing

Julia Alles et al. FEBS Open Bio. .

Abstract

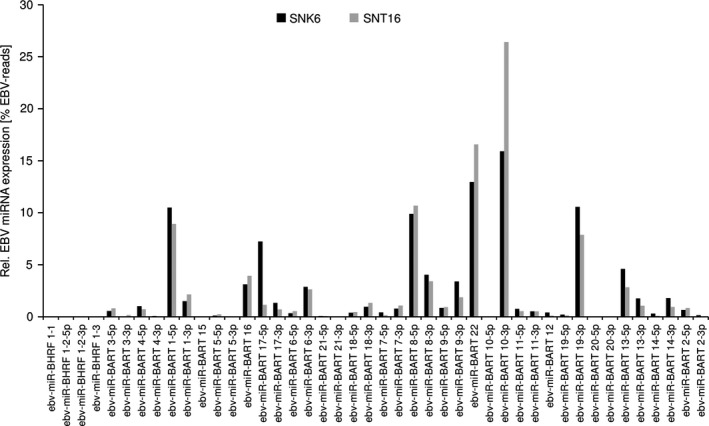
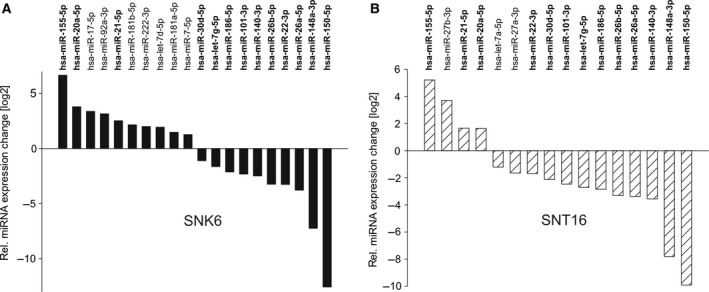
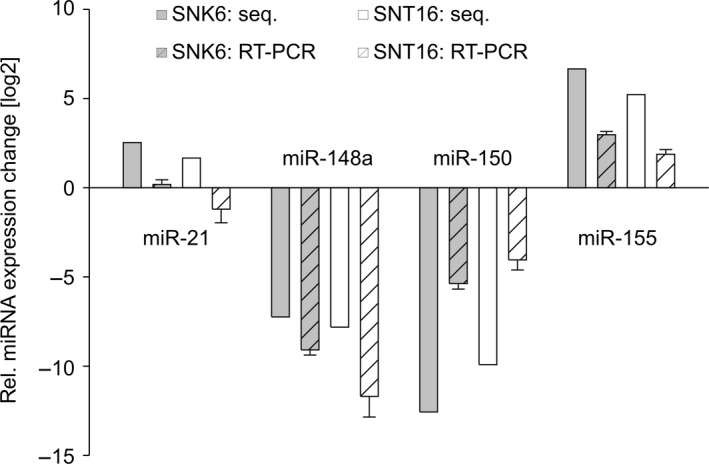
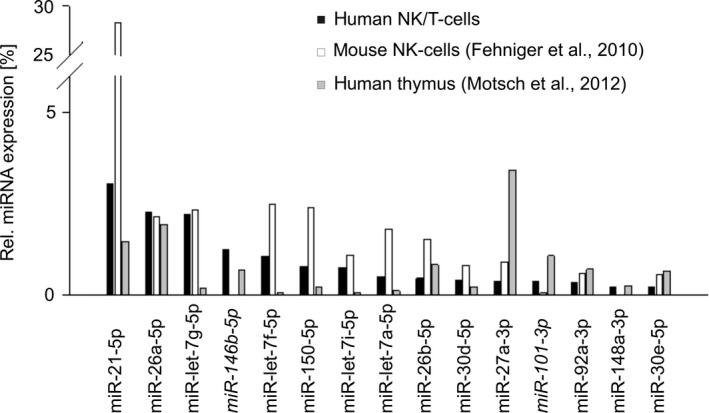
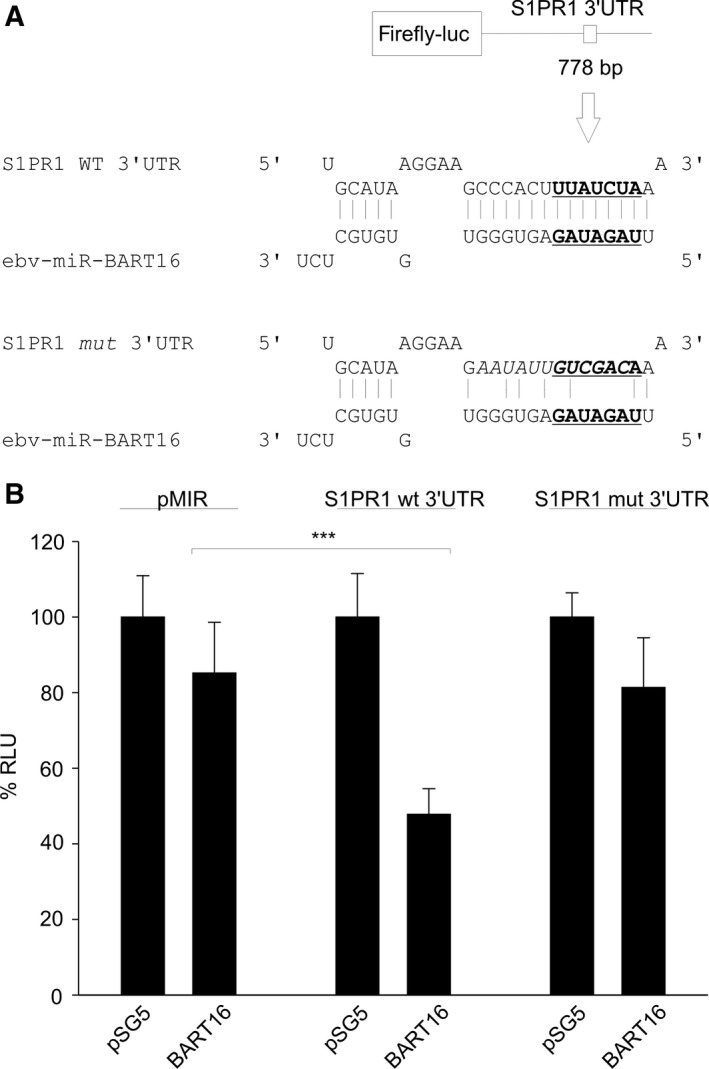
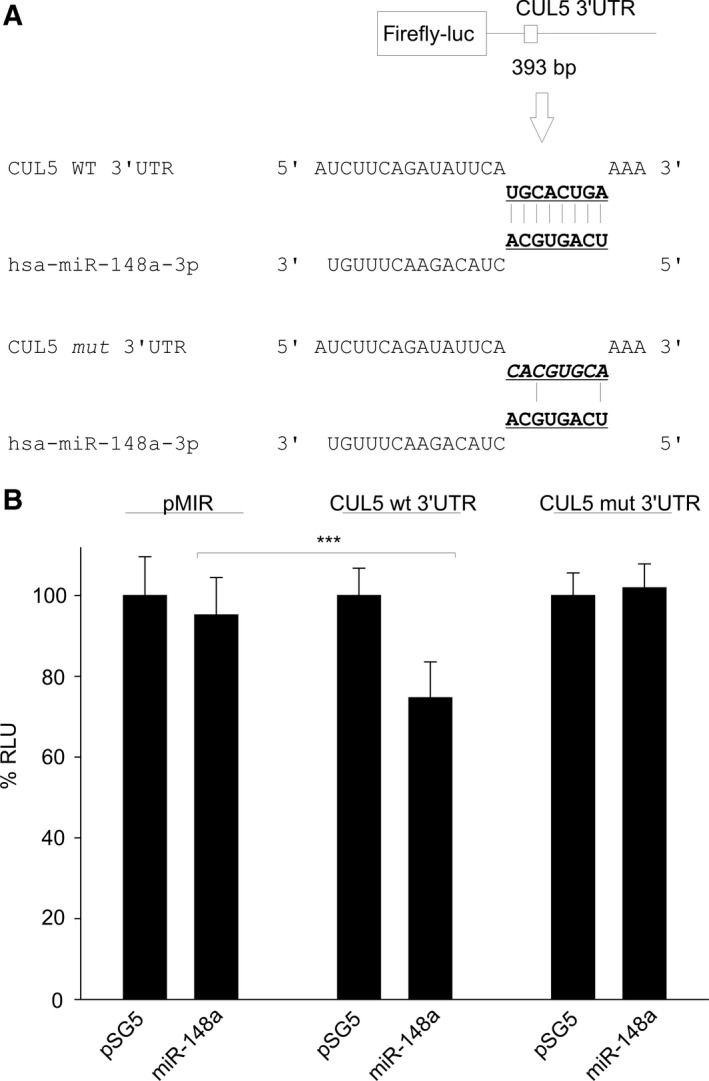
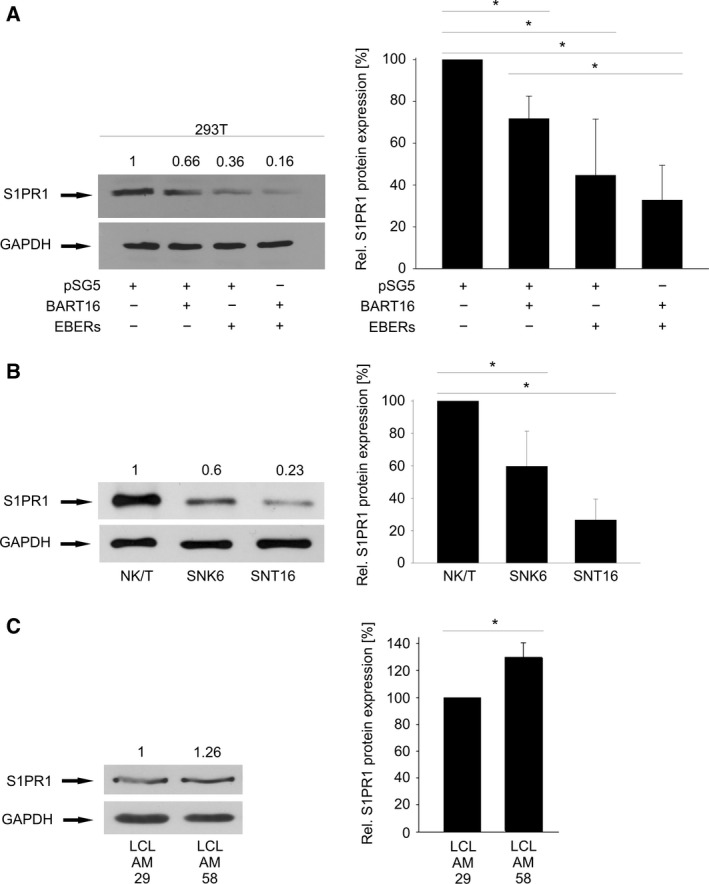
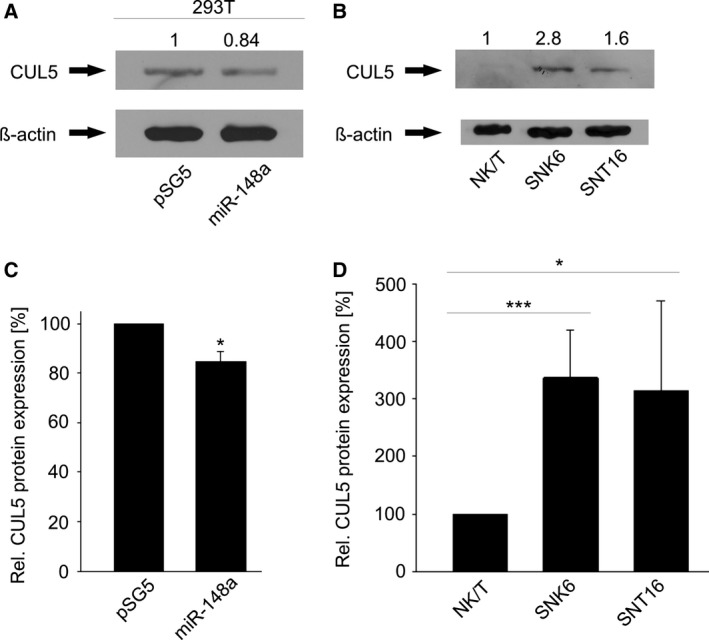
The aim of this work was to establish the microRNA profile of SNK6 and SNT16, two Epstein-Barr virus (EBV)-infected cell lines derived from nasal NK/T-cell lymphoma (NKTL). The oncogenic EBV is strongly associated with the pathogenesis of nasal and extranodal NK/T-cell lymphoma and expresses 44 mature microRNAs and two noncoding EBV-encoded RNAs (EBERs). miRNAs are 19-25nt noncoding RNAs that affect host and viral gene expression post-transcriptionally. Deregulated miRNA patterns are frequently linked to a variety of human cancers including lymphomas. miRNA profiling of the two NK/T cell lines vs. primary cells revealed 10 and 4 up-regulated and 10 and 12 down-regulated miRNAs in SNK6 and SNT16 cells respectively. The results were validated by qRT-PCR for selected miRNAs. Target gene analyses confirmed cullin 5 (CUL5) and sphingosin-1-phosphate receptor 1 (S1PR1) as targets for the down-regulated hsa-miR-148a and viral ebv-miR-BART16 respectively. As recently demonstrated for the regulation of IL1-alpha by miR-142-3p, coexpression of the EBERs selectively exerted corepression of S1PR1 by BART16 but not of CUL5 by miR-148a, indicating selective corepression by the EBERs.

Keywords: CUL5; Epstein‐Barr virus; S1PR1; ebv‐miR‐BART16; hsa‐miR‐148a; microRNA.


Figures

Figure 1
Figure 1
Comparison of EBV‐miRNA expression levels in NKTL‐cell lines. ebv‐miRNA expression in the SNK6 vs. SNT16 cell lines. The relative levels of the ebv‐miRNAs obtained by sequencing of the two NK/T‐lymphoma cell lines were compared with each other. Black: SNK6, grey: SNT16.
Figure 2
Figure 2
MicroRNA profiling of primary CD56+/CD3+ NK/T cells and the NK/T cell lines SNK6 (A) and SNT16 (B). MiRNAs up‐ or down‐regulated at least 1.5 fold in SNK6 or SNT16 cells compared to primary CD56+/CD3+ NK/T cells, with a representation of at least 0.1% in one of the cDNA libraries are depicted.
Figure 3
Figure 3
Validation of the Illumina results. The relative levels (SNK6 or SNT16/primary cells) of the four miRNAs hsa‐miR‐21 and hsa‐miR‐155 (determined as up‐regulated by sequencing) and hsa‐miR‐148a and hsa‐miR‐150 (determined as down‐regulated by sequencing), analysed by qRTPCR are shown. The graph represents the results of at least three independent experiments. Error bars show SD.
Figure 4
Figure 4
Top 10 miRNAs in human NK/T cells vs. mouse NK cells vs. thymus. Comparison of the top 10 miRNAs expressed in primary human CD56+/CD3+ NK/T cells (black) to our previous sequencing analysis of thymus tissue (grey) 33 and the sequencing analysis of activated mouse NK cells (white) 43. (comment on miRNAs in italic: miR‐146b: sequencing data from thymus counted for miR‐146a+b. miR‐101: among mmu‐miRNAs there are miR‐101a/b/c, in the human miRNA database only miR‐101‐5p and ‐3p are listed. Therefore, the sequencing data for mmu‐miR‐101 do not show up in this graph).
Figure 5
Figure 5
S1PR1 3′UTR is targeted by ebv‐miR‐BART16. (A) Schematic representation of the pMIR‐S1PR1 3′UTR reporter construct (upper panel) and prediction of the ebv‐BART16 binding site. The mutated binding site for BART16 is shown in the lower panel. (B) Dual‐luciferase reporter assays for ebv‐miR‐BART16 and S1PR1 3′UTR. Co‐transfection of the S1PR1 WT‐reporter construct with pSG5‐BART16 results in a significant decrease in luciferase activity compared to the empty pMIR reporter vector. Using the S1PR1 reporter with mutated BART16 binding site, no effect was observed. The graph represents the results of at least three independent experiments carried out in duplicate. Error bars show SD. Stars denote: ***P < 0.001.
Figure 6
Figure 6
CUL5 3′UTR is targeted by hsa‐miR‐148a. (A) Schematic representation of the pMIRCUL5 3′UTR reporter construct (upper panel) and prediction of the miR‐148a binding site. The mutated binding site for miR‐148a is shown in the lower panel. (B) Dual‐luciferase reporter assays for miR‐148a and CUL5 3′UTR. Co‐transfection of the CUL5 WT‐reporter construct with pSG5‐miR‐148a results in a significant decrease in luciferase activity compared to the empty pMIR reporter vector. Using the CUL5 reporter with mutated miR‐148a binding site, no effect was observed. The graph represents the results of at least three independent experiments carried out in duplicate. Error bars show SD. Stars denote: ***P = 0.0005.
Figure 7
Figure 7
Down‐regulation of S1PR1 protein by ebv‐miR‐BART16 and EBER. Western Blot analyses of S1PR1 levels in cell lines. (A) The empty pSG5 vector, pSG5‐BART16 and pSG5‐EBERs were transfected in HEK293T cells. The expression of BART16 and EBERs alone down‐regulated S1PR1 levels significantly (*P = 0.01, *P = 0.02 respectively). Co‐expression of BART16 and the EBERs further down‐regulated the S1PR1 protein level to a stronger extent than the BART16 plasmid alone (*P = 0.03) (B) S1PR1 is down‐regulated in NK/T‐cell lines (SNK6 and SNT16) compared to nontransformed CD56+/CD3+ primary cells (*P = 0.03, *P = 0.0006 respectively). (C) S1PR1 levels in lymphoblastoid cell lines established with an EBER‐deleted EBV (LCL AM 58) or with the parental EBV (LCL AM 29) (*P = 0.008). The quantification of at least three independent experiments is shown on the right side of a representative blot. Error bars show SD.
Figure 8
Figure 8
Down‐regulation of CUL5 protein by hsa‐miR‐148a. Western Blot analyses of CUL5 levels. (A) pSG5‐miR‐148a and the empty control (pSG5) were transfected in HEK293T cells. miR‐148a overexpression down‐regulated the CUL5 level significantly (*P = 0.0003). (B) CUL5 is up‐regulated in NK/T‐cell lines (SNK6 and SNT16) compared to nontransformed CD56+/CD3+‐primary cells (***P = 0.0002, *P = 0.016 respectively). (C, D) Western Blot quantification of at least three independent experiments. Error bars show SD.

References

    1. Kieff E and Rickinson AE (2007) Epstein‐Barr Virus and its replication In Fields Virology. Vol. 2, 5th edn (Knipe D, Griffin DE, Lamb RA, Strauss SE, Howley PM, Martin MA. and Roizman B, eds), pp. 2603–2654. Lippincott Williams & Wilkins, Philadelphia, PA.
    1. Delecluse HJ, Feederle R, O'Sullivan B and Taniere P (2007) Epstein Barr virus‐associated tumours: an update for the attention of the working pathologist. J Clin Pathol 60, 1358–1364. - PMC - PubMed
    1. Rickinson AB and Kieff E (2007) Epstein‐Barr virus In Fields Virology. Vol. 2 (Knipe D, Griffin DE, Lamb RA, Strauss SE, Howley PM, Martin MA. and Roizman B, eds), pp. 2655–2700. Lippincott Williams & Wilkins, Philadelphia, PA.
    1. Suzumiya J (2008) NK‐cell lymphoma: pathogenesis and clinical features. Rinsho Ketsueki 49, 545–552. - PubMed
    1. Jaffe ES, Chan JK, Su IJ, Frizzera G, Mori S, Feller AC and Ho FC (1996) Report of the Workshop on Nasal and Related Extranodal Angiocentric T/Natural Killer Cell Lymphomas. Definitions, differential diagnosis, and epidemiology. Am J Surg Pathol 20, 103–111. - PubMed

LinkOut - more resources