

The Impact of Serum Amyloid P-Component on Gene Expression in RAW264.7 Mouse Macrophages
- PMID: 27239478
- PMCID: PMC4864538
- DOI: 10.1155/2016/9380290
The Impact of Serum Amyloid P-Component on Gene Expression in RAW264.7 Mouse Macrophages
Abstract
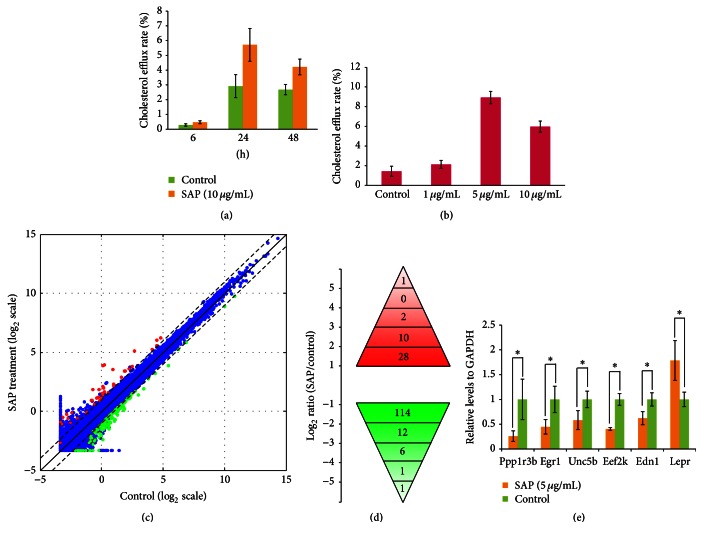
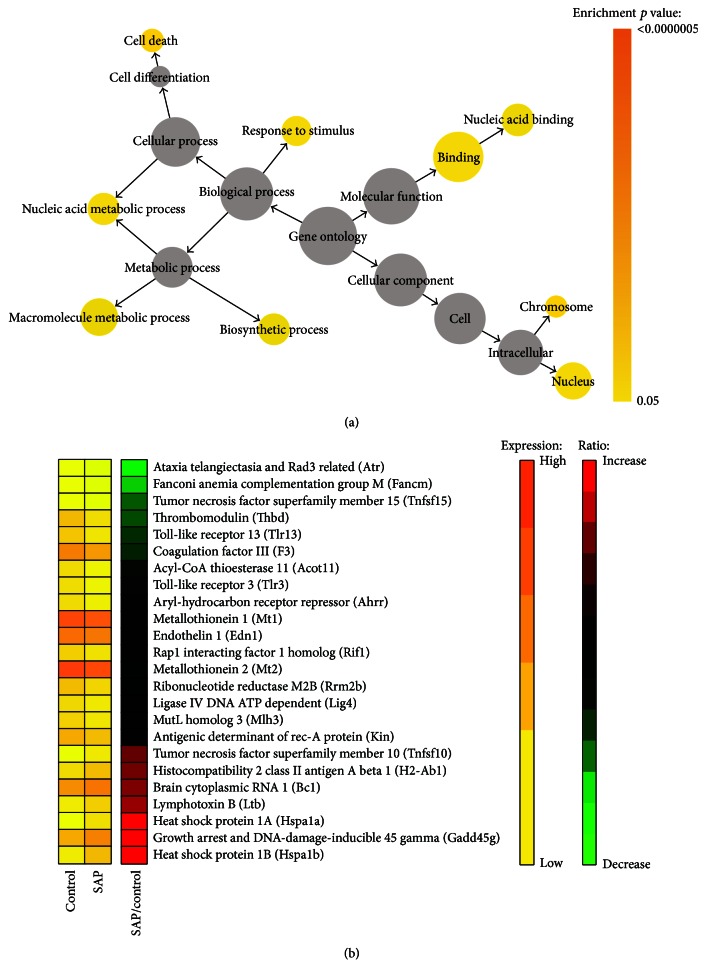
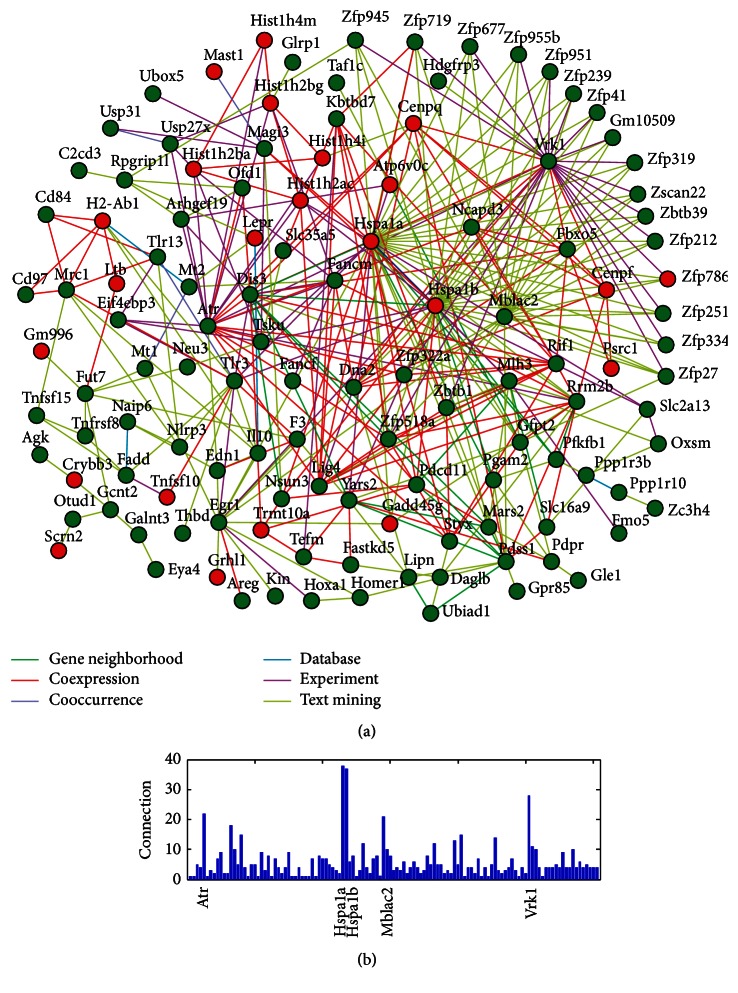
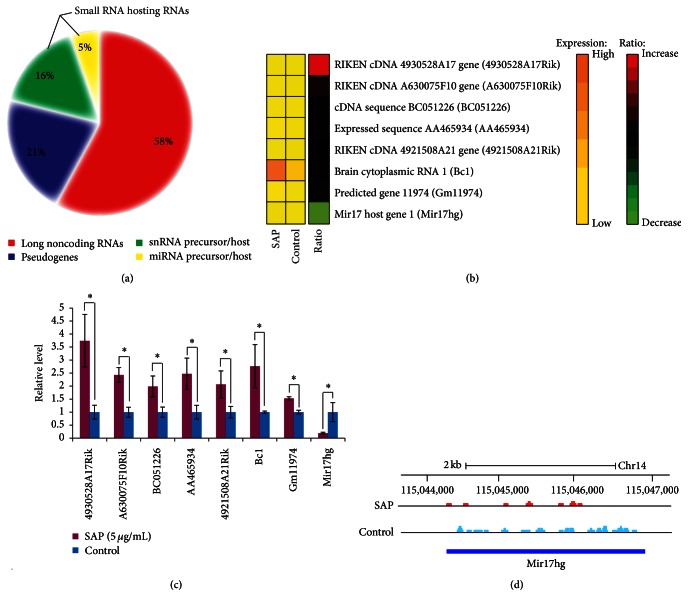
Serum amyloid P-component (SAP) contributes to host defense and prevents fibrosis. Macrophages are the most abundant inflammatory cell type in atherosclerotic plaques. In the present study, using (3)H-cholesterol-labeled counting radioactivity assay, we demonstrated that the apoAI-mediated cholesterol efflux in RAW264.7 macrophages was increased by SAP treatment in a time- and dose-dependent manner. We analyzed global gene expression changes upon SAP treatment using RNA sequencing. As a result, a total of 175 differentially expressed genes were identified, of which 134 genes were downregulated and 41 genes were upregulated in SAP treated cells compared to control cells. Quantitative RT-PCR analysis confirmed decreased expression of 5 genes and an increase in expression of 1 gene upon SAP treatment. Gene ontology analysis showed that genes involved in response to stimulus were significantly enriched in differentially expressed genes. Beyond protein-coding genes, we also identified 8 differentially expressed long noncoding RNAs. Our study may provide new insights into mechanisms underlying the functional role of SAP in macrophages.
Figures
Similar articles
-
Serum amyloid P component therapeutically attenuates atherosclerosis in mice via its effects on macrophages.Theranostics. 2018 May 11;8(12):3214-3223. doi: 10.7150/thno.22704. eCollection 2018. Theranostics. 2018. PMID: 29930724 Free PMC article.
-
SAP deficiency mitigated atherosclerotic lesions in ApoE(-/-) mice.Atherosclerosis. 2016 Jan;244:179-87. doi: 10.1016/j.atherosclerosis.2015.11.009. Epub 2015 Nov 23. Atherosclerosis. 2016. PMID: 26649902
-
Acute phase induction of mouse serum amyloid P component. Correlation with other parameters of inflammation.J Immunol. 1989 Nov 1;143(9):2880-6. J Immunol. 1989. PMID: 2809211
-
Liver-specific and high-level expression of human serum amyloid P component gene in transgenic mice.Dev Genet. 1989;10(5):365-71. doi: 10.1002/dvg.1020100504. Dev Genet. 1989. PMID: 2598499
-
Use of genetically altered mice to study the role of serum amyloid P component in amyloid deposition.Amyloid. 2003 Aug;10 Suppl 1:17-20. Amyloid. 2003. PMID: 14640037 Review.
Cited by
-
The impact of PSRC1 overexpression on gene and transcript expression profiling in the livers of ApoE-/- mice fed a high-fat diet.Mol Cell Biochem. 2020 Feb;465(1-2):125-139. doi: 10.1007/s11010-019-03673-x. Epub 2019 Dec 14. Mol Cell Biochem. 2020. PMID: 31838625
-
Serum amyloid P component therapeutically attenuates atherosclerosis in mice via its effects on macrophages.Theranostics. 2018 May 11;8(12):3214-3223. doi: 10.7150/thno.22704. eCollection 2018. Theranostics. 2018. PMID: 29930724 Free PMC article.
-
1H-NMR-Based Metabonomics Study to Reveal the Progressive Metabolism Regulation of SAP Deficiency on ApoE-/- Mice.Metabolites. 2022 Dec 16;12(12):1278. doi: 10.3390/metabo12121278. Metabolites. 2022. PMID: 36557316 Free PMC article.
-
The Western Diet Regulates Hippocampal Microvascular Gene Expression: An Integrated Genomic Analyses in Female Mice.Sci Rep. 2019 Dec 13;9(1):19058. doi: 10.1038/s41598-019-55533-9. Sci Rep. 2019. PMID: 31836762 Free PMC article.
-
Differentially expressed serum host proteins in hepatitis B and C viral infections.Virusdisease. 2018 Dec;29(4):468-477. doi: 10.1007/s13337-018-0484-y. Epub 2018 Sep 1. Virusdisease. 2018. PMID: 30539049 Free PMC article.
References
-
- Watanabe J., Grijalva V., Hama S., et al. Hemoglobin and its scavenger protein haptoglobin associate with ApoA-1-containing particles and influence the inflammatory properties and function of high density lipoprotein. The Journal of Biological Chemistry. 2009;284(27):18292–18301. doi: 10.1074/jbc.m109.017202. - DOI - PMC - PubMed
MeSH terms
Substances
LinkOut - more resources
Full Text Sources
Other Literature Sources
Medical
Research Materials
Miscellaneous
