. 2015 Mar 29;1(1):112-24.
doi: 10.1016/j.dadm.2014.11.012. eCollection 2015 Mar.

Automatic speech analysis for the assessment of patients with predementia and Alzheimer's disease

Affiliations

Automatic speech analysis for the assessment of patients with predementia and Alzheimer's disease

Alexandra König et al. Alzheimers Dement (Amst). .

Abstract

Background: To evaluate the interest of using automatic speech analyses for the assessment of mild cognitive impairment (MCI) and early-stage Alzheimer's disease (AD).

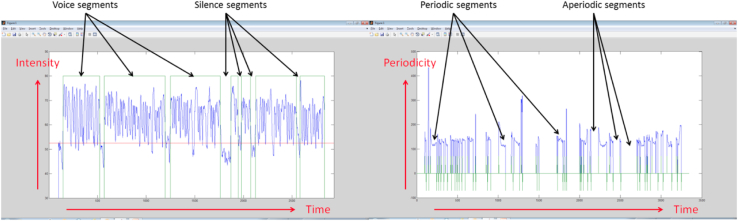
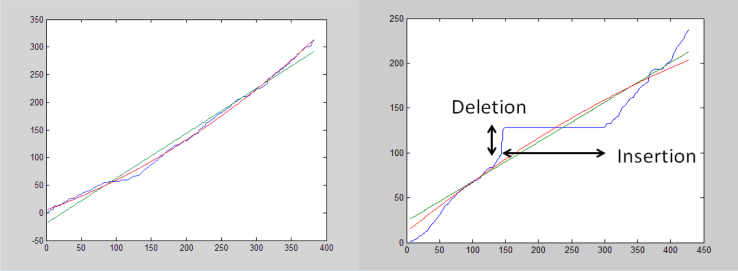
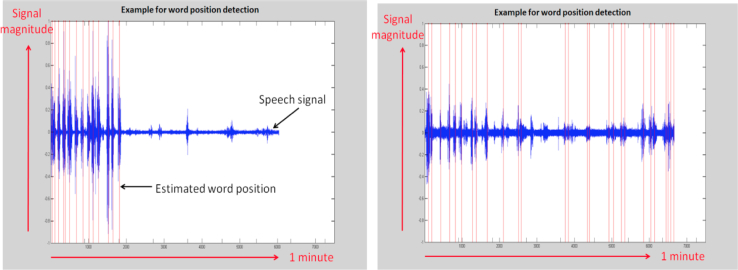
Methods: Healthy elderly control (HC) subjects and patients with MCI or AD were recorded while performing several short cognitive vocal tasks. The voice recordings were processed, and the first vocal markers were extracted using speech signal processing techniques. Second, the vocal markers were tested to assess their "power" to distinguish among HC, MCI, and AD. The second step included training automatic classifiers for detecting MCI and AD, using machine learning methods and testing the detection accuracy.

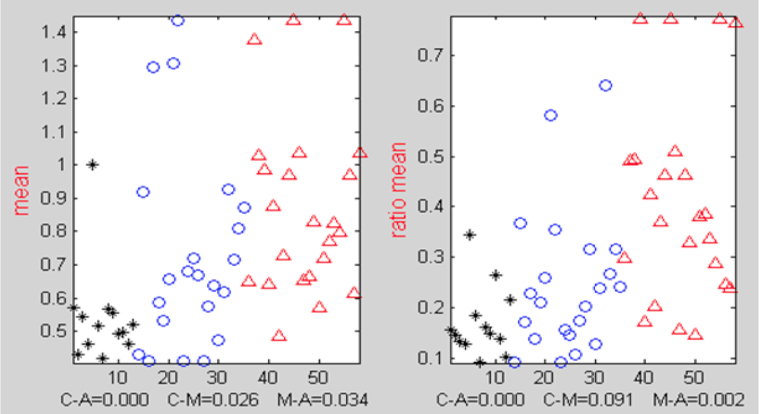
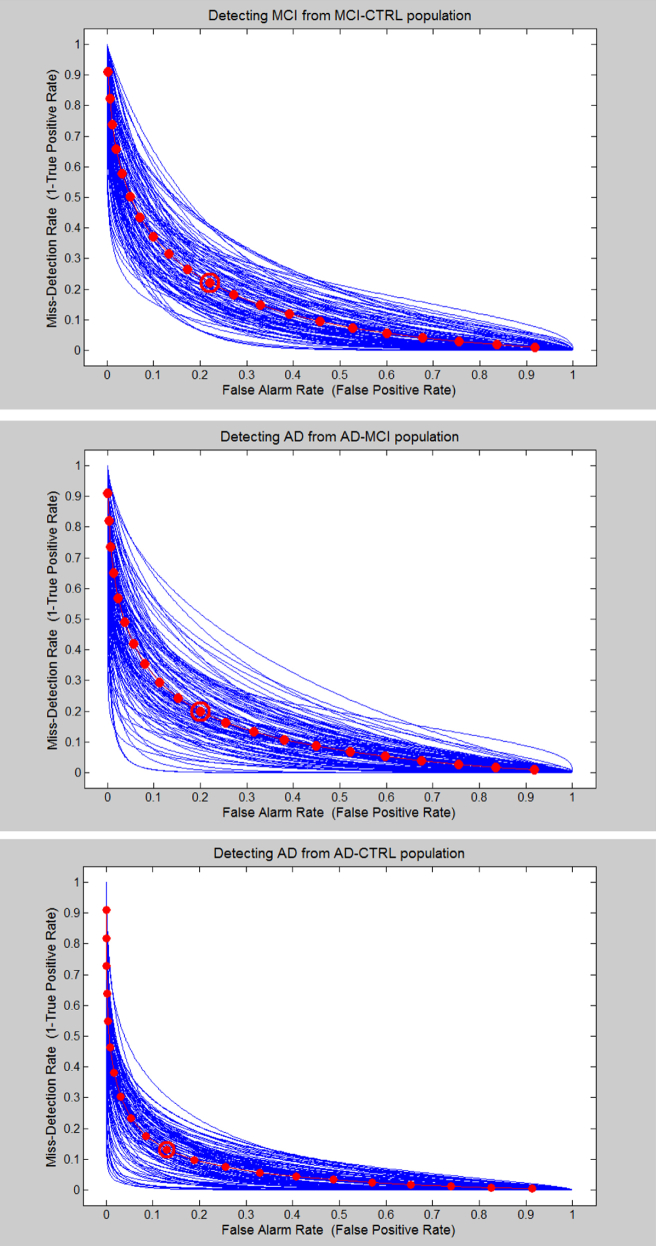
Results: The classification accuracy of automatic audio analyses were as follows: between HCs and those with MCI, 79% ± 5%; between HCs and those with AD, 87% ± 3%; and between those with MCI and those with AD, 80% ± 5%, demonstrating its assessment utility.

Conclusion: Automatic speech analyses could be an additional objective assessment tool for elderly with cognitive decline.

Keywords: Alzheimer's; Assessment; Audio; Dementia; Information and communication technology (ICT); Mild cognitive impairment; Speech analyses; Vocal task.


Figures

Fig. 1
Fig. 1
Voice versus silence segments and periodic versus aperiodic segments of a typical spoken task recording. The horizontal axis designates time frames of 10 ms; the vertical axis on the left designates the signal intensity and that on the right designates the signal periodicity. Voice versus silence and periodic versus aperiodic were determined from the smoothed intensity and periodicity contours, respectively.
Fig. 2
Fig. 2
Time alignment between the clinician's sentence and the participant's repeated sentence. The horizontal axis designates the time of the participant's signal (in 10-ms frames); the vertical axis, the time of the clinician's signal (in 10-ms frames). The blue curve shows the “best” match (alignment) between the two signals; the green line and red curve, the best linear and second-order approximations of the blue curve, respectively.
Fig. 3
Fig. 3
The time positions of the individual words along a 1-minute recording. (Left) View of recording of healthy elderly control, demonstrating a faster rate of uttering words (assumed to be animal names) at least at the beginning of the task. (Right) View of a recording of a patient with Alzheimer's disease, demonstrating a slower rate of uttering words at the beginning of the task.
Fig. 4
Fig. 4
Distributions and P values from Mann-Whitney U tests for silence durations. Horizontal axis designates the participant index. Black asterisks indicate healthy elderly controls; blue circles, those with mild cognitive impairment; and red triangles, those with Alzheimer's disease. The values for each class tended to be higher (or lower) than those in another class. Also shown are the P values for the three classification scenarios. The ratio mean (right) helped in distinguishing between those with mild cognitive impairment and Alzheimer's disease better than the plain arithmetic mean (left).
Fig. 5
Fig. 5
Plots of the false alarm error probability (horizontal axis) versus the misdetection error probability (vertical axis), which was 1 minus the standard receiver operating characteristic curve.

Similar articles

Cited by

References

    1. Braaten A.J., Parsons T.D., McCue R., Sellers A., Burns W.J. Neurocognitive differential diagnosis of dementing diseases: Alzheimer's dementia, vascular dementia, frontotemporal dementia, and major depressive disorder. Int J Neurosci. 2006;116:1271–1293. - PubMed
    1. Ahmed S., Haigh A.M., de Jager C.A., Garrard P. Connected speech as a marker of disease progression in autopsy-proven Alzheimer's disease. Brain. 2013;136(Pt 12):3727–3737. - PMC - PubMed
    1. Forbes K.E., Venneri A., Shanks M.F. Distinct patterns of spontaneous speech deterioration: An early predictor of Alzheimer's disease. Brain Cogn. 2002;48:356–361. - PubMed
    1. Sacco G., Joumier V., Darmon N., Dechamps A., Derreumaux A., Lee J.H. Detection of activities of daily living impairment in Alzheimer's disease and mild cognitive impairment using information and communication technology. Clin Interv Aging. 2012;7:539–549. - PMC - PubMed
    1. Yakhia M., Konig A., van der Flier W.M., Friedman L., Robert P.H., David R. Actigraphic motor activity in mild cognitive impairment patients carrying out short functional activity tasks: Comparison between mild cognitive impairment with and without depressive symptoms. J Alzheimers Dis. 2014;40:869–875. - PubMed