. 2016 Jul;12(7):559-66.
doi: 10.1038/nchembio.2097. Epub 2016 May 30.

Zebrafish behavioral profiling identifies multitarget antipsychotic-like compounds

Affiliations

Zebrafish behavioral profiling identifies multitarget antipsychotic-like compounds

Giancarlo Bruni et al. Nat Chem Biol. 2016 Jul.

Abstract

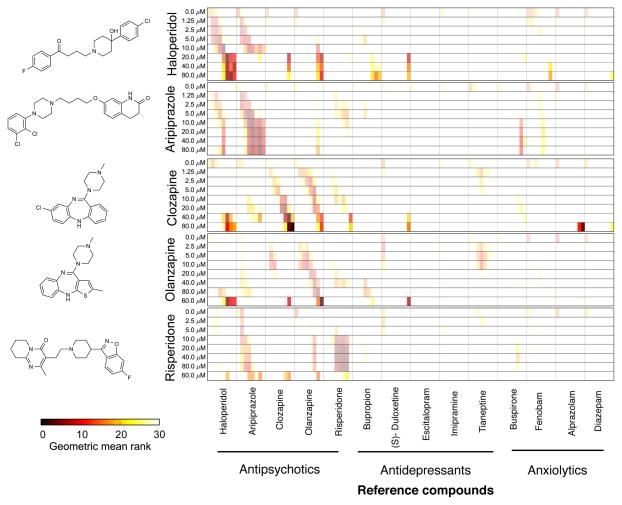
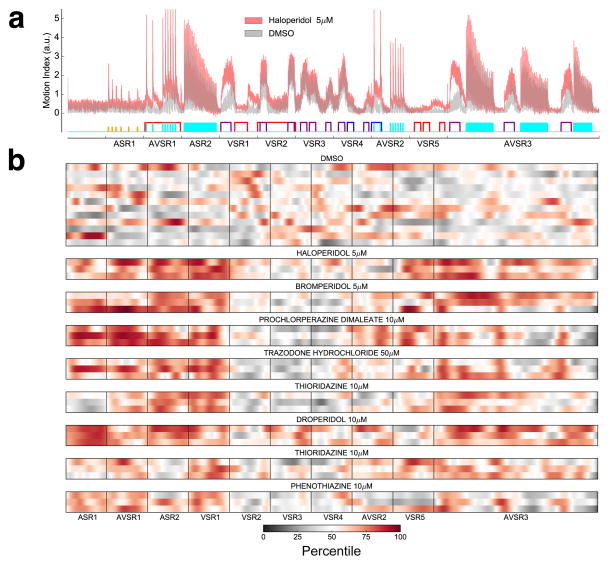
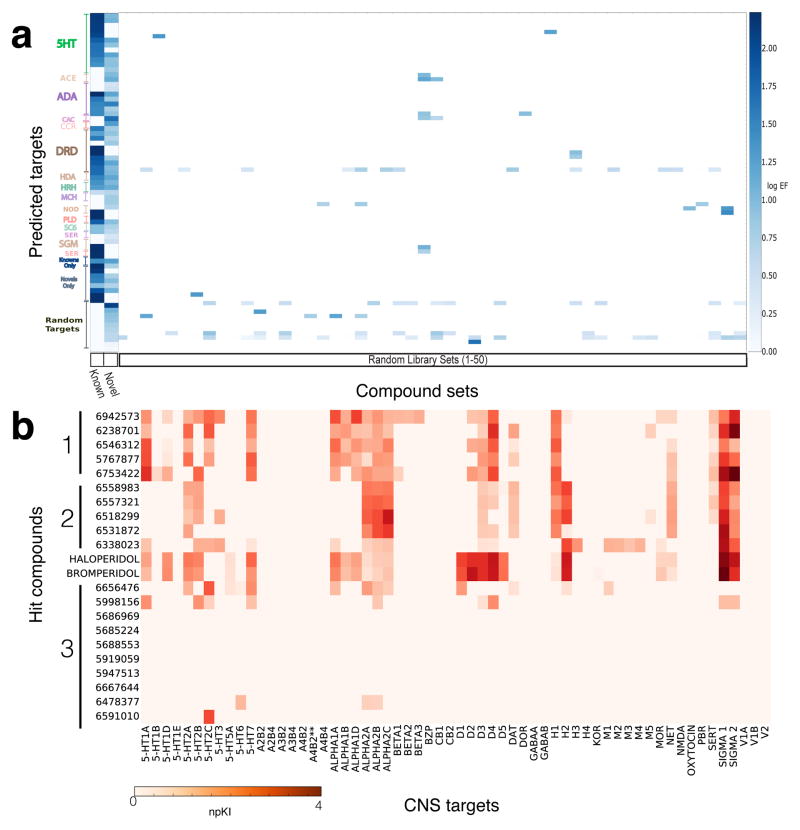
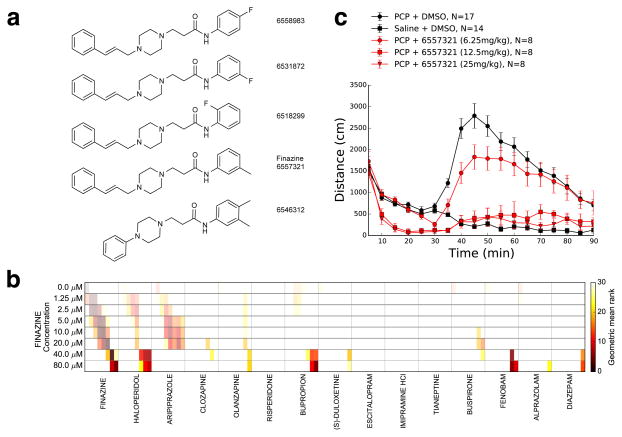
Many psychiatric drugs act on multiple targets and therefore require screening assays that encompass a wide target space. With sufficiently rich phenotyping and a large sampling of compounds, it should be possible to identify compounds with desired mechanisms of action on the basis of behavioral profiles alone. Although zebrafish (Danio rerio) behavior has been used to rapidly identify neuroactive compounds, it is not clear what types of behavioral assays would be necessary to identify multitarget compounds such as antipsychotics. Here we developed a battery of behavioral assays in larval zebrafish to determine whether behavioral profiles can provide sufficient phenotypic resolution to identify and classify psychiatric drugs. Using the antipsychotic drug haloperidol as a test case, we found that behavioral profiles of haloperidol-treated zebrafish could be used to identify previously uncharacterized compounds with desired antipsychotic-like activities and multitarget mechanisms of action.


Conflict of interest statement

Competing financial interests

AJR, DK and RTP declare competing financial interests in the form of a pending patent application, No. PCT/US2015/037755, covering the finazine compounds described in this manuscript. AV, TE, GC and DL are full time employees of Teleos Therapeutics. DK and RTP consult for Teleos Therapeutics. SK and EP are full time employees of F. Hoffmann – La Roche Ltd.

Figures

Figure 1
Figure 1. Antipsychotics and other psychiatric drugs affect zebrafish behavior
(a) Plot showing the average motion index (MI) of control animals as a function of time. Assay names and their order in the battery are indicated as x-axis labels. The MI time series (black) is the average of 48 time-series, each obtained from a well containing 8 larvae and the shaded area (gray) covers ± 3*sem. All wells were located on the same 96-well plate. (b) Line plots showing phenotypic distance (y-axis) of the indicated compounds from DMSO control phenotypes at the indicated concentration (x-axis). The phenotypic distance of the DMSO phenotype from itself (0μM) is arbitrarily set to 0.1. The phenotype for each condition (compound & concentration) is the average of 36 time-series obtained from 36 wells screened over 3 daily experiments of 12 wells each. Each well contained 8 larvae. The phenotypic distances shown are distances between average phenotypes, so effectively n=1. Marker size represents, for each phenotype, the MI averaged over time, i.e. the area under the curve for the MI time series. Colors represent different classes of psychiatric drugs (Blue, antipsychotics; yellow, antidepressants; purple, anxiolytics). (c) Multi-dimensional scaling representation of the pairwise distances between MIs of animals treated with the indicated compounds. Larger marker sizes indicate greater concentrations. Gray circles represent equal volumes of DMSO. Each data point is the average of the same 36 time series used for panel b.
Figure 2
Figure 2. Antipsychotic drugs cause specific behavioral profiles in the test battery
Chemical structures (left) of each reference compound queried and heat maps (right) showing a matrix comparing queries (rows) and reference compounds (columns). Note that each cell of the matrix is divided into eight segments representing increasing concentrations of the indicated reference compound (left to right). Heat map color represents the phenotypic similarity ranking as indicated in the color bar (see Methods). Color saturation represents the magnitude of the behavioral distance from DMSO controls, such that darker colors represent larger magnitudes. Each condition (compound & concentration) is the average of 36 time-series obtained from 36 wells screened over 3 daily experiments of 12 wells each. Each well contained 8 larvae.
Figure 3
Figure 3. Haloperidol causes complex behavioral phenotypes in the zebrafish
(a) Average MI of animals treated with haloperidol (5μM) or DMSO (n= 48 wells per condition). (b) Heat maps showing the effect of indicated antipsychotic compounds on zebrafish motor activity. For every drug treatment, each of the three rows represents a single well (8 larvae). The x-axis indicates time and specific assays administered as shown in panel a. Color indicates percentile ranking of the motion index relative to DMSO controls (8 wells, each containing 8 larvae).
Figure 4
Figure 4. Hit compounds show haloperidol-like target profiles
(a) Library-wide target signatures for known antipsychotics and uncharacterized compound hits as calculated by SEA. Heat map of shared target enrichments for known and uncharacterized groups, as compared to 1,000 randomly-selected size-matched groups from the underlying screening library. Out of 1,873 possible targets, fewer than 58 were significantly enriched for the known or uncharacterized groups. The y-axis shows the 58 enriched targets for the known and uncharacterized groups. 50 random groups are shown for context. Significantly enriched target classes for known and uncharacterized groups were: 5-HT: serotonin receptors, ADA and ADR: alpha and beta adrenergic receptors, CAC: voltage-dependent T-type calcium channels, DRD: dopamine receptors, HDA: histone deacetylases, HRH: histamine receptors, SGM: sigma receptors; for others see Supplementary Table 4 for full list. Enrichment factors (EF) of ≥ 2.0 and q-value ≤ 1e-10 are shown in blue, on a log scale. (b) Binding affinity profiles (as computed npKi values) of 22 uncharacterized hit compounds (rows) at 60 human and rodent CNS receptors in vitro (columns) in addition to haloperidol and bromperidol controls.
Figure 5
Figure 5. Finazine phenocopies haloperidol in zebrafish and in mice
(a) The five compound structures in the finazine cluster (arrow). (b) Heat map showing the phenotypic similarity rank of 14 psychiatric drugs (columns) relative to the finazine query at each indicated concentration (rows). Each cell in the matrix is divided into 8 segments to represent different concentrations, and similarity rank is indicated in the color bar. (c) Plot of mouse locomotor activity as measured by distance traveled (y-axis) during the psychostimulant (PCP)-induced locomotor assay. Different treatments are as indicated; DMSO indicates the vehicle control and 6557321 indicates finazine. PCP was administered at 30 min (arrow). Values are mean ± sem.

References

    1. Roth BL, Sheffler DJ, Kroeze WK. Magic shotguns versus magic bullets: selectively non-selective drugs for mood disorders and schizophrenia. Nat Rev Drug Discov. 2004;3:353–359. - PubMed
    1. Kokel D, Peterson RT. Chemobehavioural phenomics and behaviour-based psychiatric drug discovery in the zebrafish. Brief Funct Genomic Proteomic. 2008;7:483–490. - PMC - PubMed
    1. Besnard J, et al. Automated design of ligands to polypharmacological profiles. Nature. 2012;492:215–220. - PMC - PubMed
    1. Paul SM, et al. How to improve R&D productivity: the pharmaceutical industry’s grand challenge. Nat Rev Drug Discov. 2010;9:203–214. - PubMed
    1. López-Muñoz F, Alamo C. The consolidation of neuroleptic therapy: Janssen, the discovery of haloperidol and its introduction into clinical practice. Brain research bulletin. 2009;79:130–141. - PubMed

Publication types

Substances