

Public Reporting of Mortality Rates for Hospitalized Medicare Patients and Trends in Mortality for Reported Conditions
- PMID: 27239794
- PMCID: PMC6935351
- DOI: 10.7326/M15-1462
Public Reporting of Mortality Rates for Hospitalized Medicare Patients and Trends in Mortality for Reported Conditions
Abstract
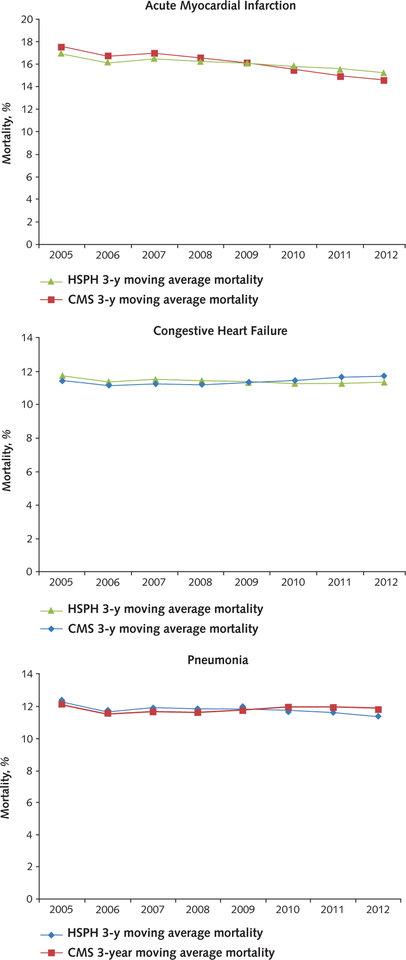
Background: Public reporting is seen as a powerful quality improvement tool, but data to support its efficacy are limited. The Centers for Medicare & Medicaid Services' Hospital Compare program initially reported process metrics only but started reporting mortality rates for acute myocardial infarction, heart failure, and pneumonia in 2008.
Objective: To determine whether public reporting of mortality rates was associated with lower mortality rates for these conditions among Medicare beneficiaries.
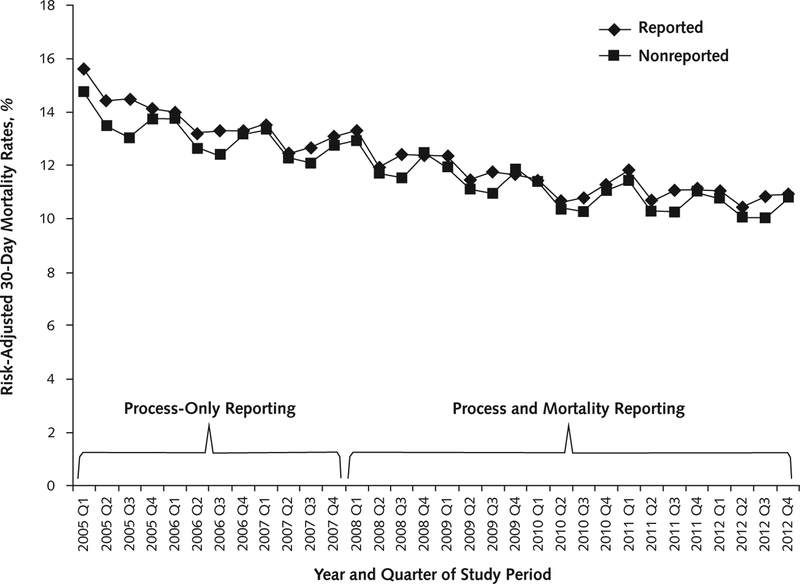
Design: For 2005 to 2007, process-only reporting was considered; for 2008 to 2012, process and mortality reporting was considered. Changes in mortality trends before and during reporting periods were estimated by using patient-level hierarchical modeling. Nonreported medical conditions were used as a secular control.
Setting: U.S. acute care hospitals.
Participants: 20 707 266 fee-for-service Medicare beneficiaries hospitalized from January 2005 through November 2012.
Measurements: 30-day risk-adjusted mortality rates.
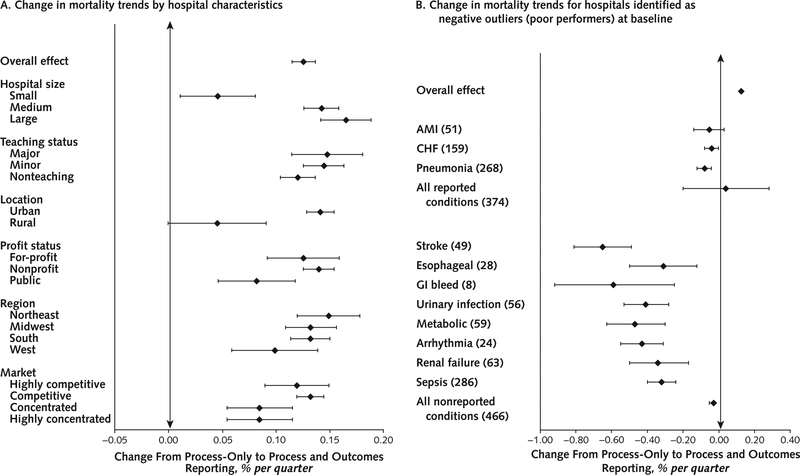
Results: Mortality rates for the 3 publicly reported conditions were changing at an absolute rate of -0.23% per quarter during process-only reporting, but this change slowed to a rate of -0.09% per quarter during process and mortality reporting (change, 0.13% per quarter; 95% CI, 0.12% to 0.14%). Mortality for nonreported conditions was changing at -0.17% per quarter during process-only reporting and slowed slightly to -0.11% per quarter during process and mortality reporting (change, 0.06% per quarter; CI, 0.05% to 0.07%).
Limitation: Administrative data may have limited ability to account for changes in patient complexity over time.
Conclusion: Changes in mortality trends suggest that reporting in Hospital Compare was associated with a slowing, rather than an improvement, in the ongoing decline in mortality among Medicare patients.
Primary funding source: National Heart, Lung, and Blood Institute.
Conflict of interest statement
Figures
Comment in
-
Public Reporting of Mortality Rates for Hospitalized Medicare Patients.Ann Intern Med. 2017 Jan 3;166(1):75-76. doi: 10.7326/L16-0546. Ann Intern Med. 2017. PMID: 28030667 Free PMC article. No abstract available.
-
Public Reporting of Mortality Rates for Hospitalized Medicare Patients.Ann Intern Med. 2017 Jan 3;166(1):75. doi: 10.7326/L16-0547. Ann Intern Med. 2017. PMID: 28030668 No abstract available.
Similar articles
-
Mortality for publicly reported conditions and overall hospital mortality rates.JAMA Intern Med. 2013 Jul 22;173(14):1351-7. doi: 10.1001/jamainternmed.2013.7049. JAMA Intern Med. 2013. PMID: 23797306
-
Relationship between hospital readmission and mortality rates for patients hospitalized with acute myocardial infarction, heart failure, or pneumonia.JAMA. 2013 Feb 13;309(6):587-93. doi: 10.1001/jama.2013.333. JAMA. 2013. PMID: 23403683 Free PMC article.
-
Mortality rates for Medicare beneficiaries admitted to critical access and non-critical access hospitals, 2002-2010.JAMA. 2013 Apr 3;309(13):1379-87. doi: 10.1001/jama.2013.2366. JAMA. 2013. PMID: 23549583
-
Association between the Value-Based Purchasing pay for performance program and patient mortality in US hospitals: observational study.BMJ. 2016 May 9;353:i2214. doi: 10.1136/bmj.i2214. BMJ. 2016. PMID: 27160187 Free PMC article.
-
Medicare's public reporting initiative on hospital quality had modest or no impact on mortality from three key conditions.Health Aff (Millwood). 2012 Mar;31(3):585-92. doi: 10.1377/hlthaff.2011.0719. Health Aff (Millwood). 2012. PMID: 22392670
Cited by
-
Systematizing Heart Failure Population Health.Heart Fail Clin. 2020 Oct;16(4):457-466. doi: 10.1016/j.hfc.2020.06.006. Epub 2020 Jul 21. Heart Fail Clin. 2020. PMID: 32888640 Free PMC article. Review.
-
Motivating provision of high quality care: it is not all about the money.BMJ. 2019 Sep 23;366:l5210. doi: 10.1136/bmj.l5210. BMJ. 2019. PMID: 31548200 Free PMC article.
-
Development of a benchmark tool for cancer centers; results from a pilot exercise.BMC Health Serv Res. 2018 Oct 10;18(1):764. doi: 10.1186/s12913-018-3574-z. BMC Health Serv Res. 2018. PMID: 30305057 Free PMC article.
-
30-Day Episode Payments and Heart Failure Outcomes Among Medicare Beneficiaries.JACC Heart Fail. 2018 May;6(5):379-387. doi: 10.1016/j.jchf.2017.11.010. Epub 2018 Apr 11. JACC Heart Fail. 2018. PMID: 29655827 Free PMC article.
-
Association of Changing Hospital Readmission Rates With Mortality Rates After Hospital Discharge.JAMA. 2017 Jul 18;318(3):270-278. doi: 10.1001/jama.2017.8444. JAMA. 2017. PMID: 28719692 Free PMC article.
References
-
- Krumholz HM, Wang Y, Mattera JA, Wang Y, Han LF, Ingber MJ, et al. An administrative claims model suitable for profiling hospital performance based on 30-day mortality rates among patients with an acute myocardial infarction. Circulation. 2006;113:1683–92. - PubMed
Publication types
MeSH terms
Grants and funding
LinkOut - more resources
Full Text Sources
Other Literature Sources
Medical