. 2016 Sep 6;165(5):325-33.
doi: 10.7326/M16-0799. Epub 2016 May 31.

The Anticipated Clinical and Economic Effects of 90-90-90 in South Africa

The Anticipated Clinical and Economic Effects of 90-90-90 in South Africa

Rochelle P Walensky et al. Ann Intern Med. .

Abstract

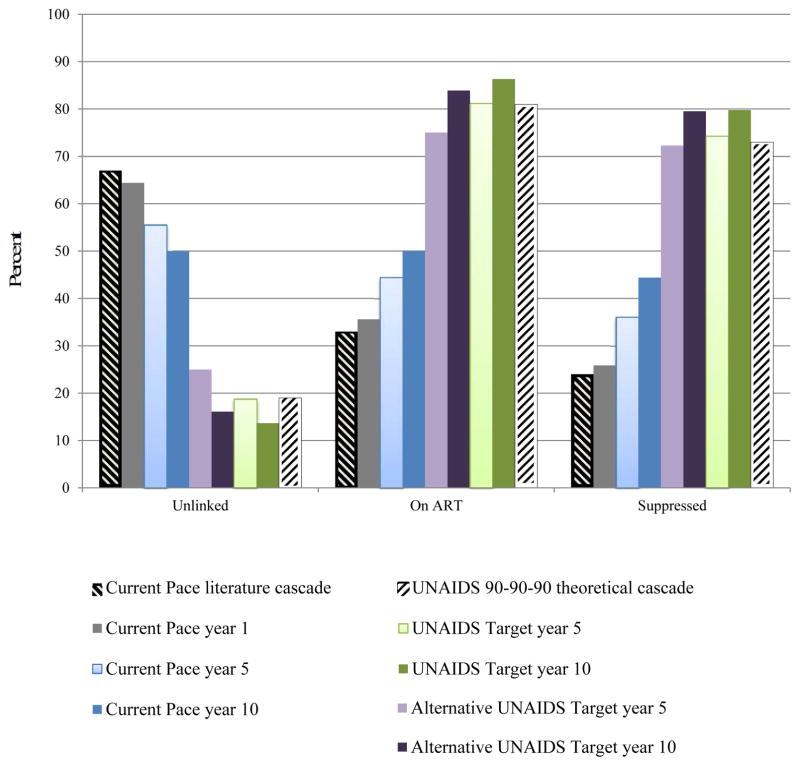
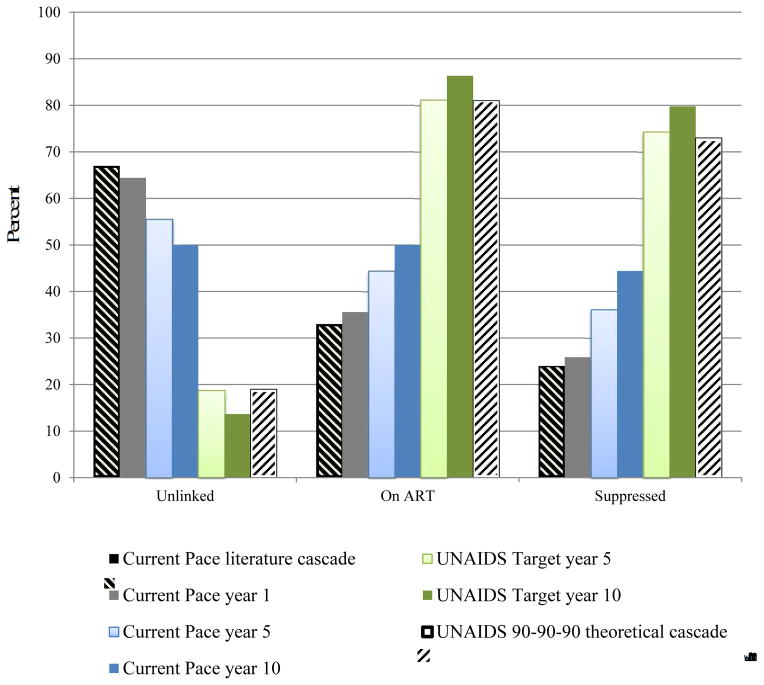
Background: The Joint United Nations Programme on HIV/AIDS (UNAIDS) 90-90-90 global treatment target aims to achieve 73% virologic suppression among HIV-infected persons worldwide by 2020.

Objective: To estimate the clinical and economic value of reaching this ambitious goal in South Africa, by using a microsimulation model of HIV detection, disease, and treatment.

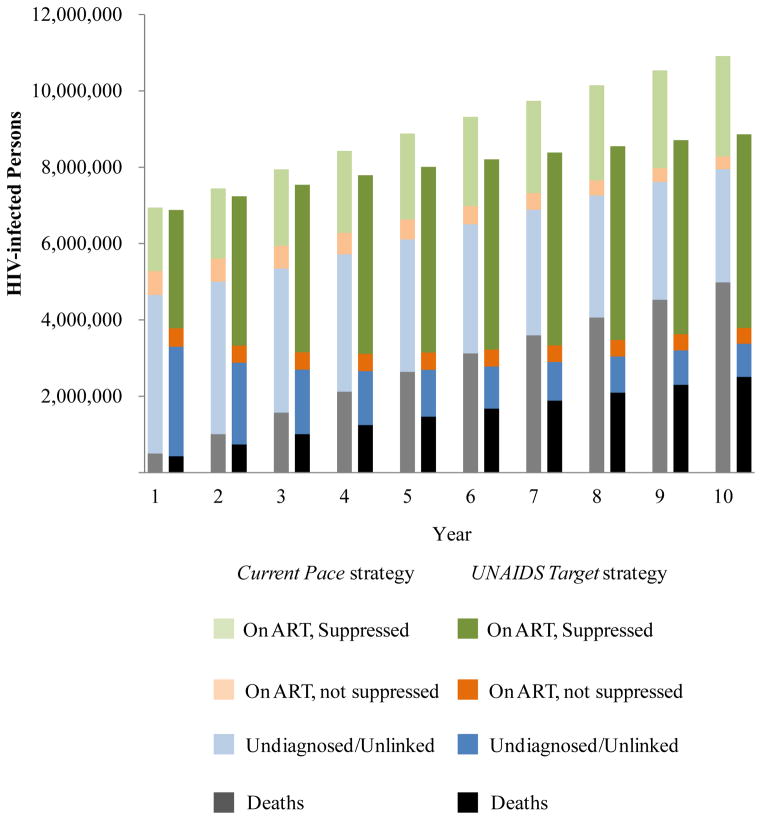
Design: Modeling of the "current pace" strategy, which simulates existing scale-up efforts and gradual increases in overall virologic suppression from 24% to 36% in 5 years, and the UNAIDS target strategy, which simulates 73% virologic suppression in 5 years.

Data sources: Published estimates and South African survey data on HIV transmission rates (0.16 to 9.03 per 100 person-years), HIV-specific age-stratified fertility rates (1.0 to 9.1 per 100 person-years), and costs of care ($11 to $31 per month for antiretroviral therapy and $20 to $157 per month for routine care).

Target population: South African HIV-infected population, including incident infections over the next 10 years.

Perspective: Modified societal perspective, excluding time and productivity costs.

Time horizon: 5 and 10 years.

Intervention: Aggressive HIV case detection, efficient linkage to care, rapid treatment scale-up, and adherence and retention interventions toward the UNAIDS target strategy.

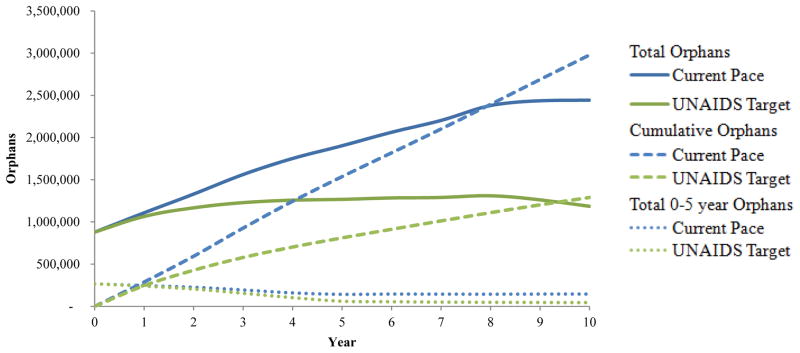
Outcome measures: HIV transmissions, deaths, years of life saved, maternal orphans, costs (2014 U.S. dollars), and cost-effectiveness.

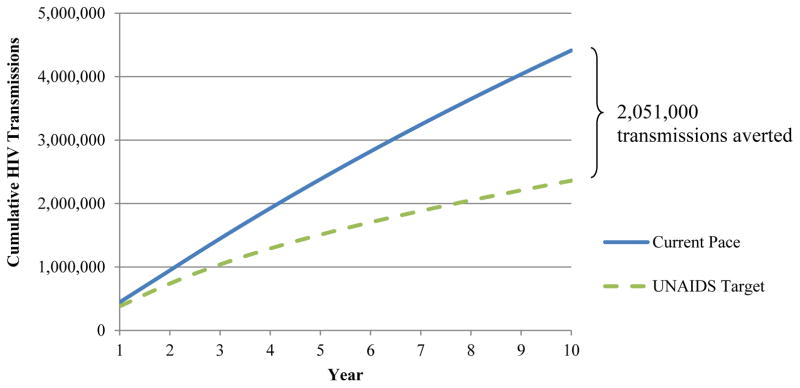
Results of base-case analysis: Compared with the current pace strategy, over 5 years the UNAIDS target strategy would avert 873 000 HIV transmissions, 1 174 000 deaths, and 726 000 maternal orphans while saving 3 002 000 life-years; over 10 years, it would avert 2 051 000 HIV transmissions, 2 478 000 deaths, and 1 689 000 maternal orphans while saving 13 340 000 life-years. The additional budget required for the UNAIDS target strategy would be $7.965 billion over 5 years and $15.979 billion over 10 years, yielding an incremental cost-effectiveness ratio of $2720 and $1260 per year of life saved, respectively.

Results of sensitivity analysis: Outcomes generally varied less than 20% from base-case outcomes when key input parameters were varied within plausible ranges.

Limitation: Several pathways may lead to 73% overall virologic suppression; these were examined in sensitivity analyses.

Conclusion: Reaching the 90-90-90 HIV suppression target would be costly but very effective and cost-effective in South Africa. Global health policymakers should mobilize the political and economic support to realize this target.

Primary funding source: National Institutes of Health and the Steve and Deborah Gorlin MGH Research Scholars Award.


Figures

Appendix Figure 1
Appendix Figure 1. Cumulative HIV transmissions
The cumulative number of HIV transmissions (vertical axis) over the 10-year modeled horizon (horizontal axis). Results for the Current Pace strategy are shown by the blue solid curve and for the UNAIDS Target strategy are shown by the green dashed curve. By the end of 2025, the UNAIDS Target strategy results in 2.051 million fewer transmission events.
Appendix Figure 2
Appendix Figure 2. HIV treatment cascade by cascade strategy; sensitivity analysis of an alternative way of reaching virologic suppression goals for the UNAIDS Target strategy
This demonstrates results of the HIV treatment cascade over time, examining the proportion of patients alive (vertical axis) who are unlinked, on ART, or virologically suppressed (horizontal axis). Current Pace strategy: The hatched black bar on the left demonstrates literature-based data to inform the current South Africa cascade of care. The grey bar represents model-based results after 1 year of the current cascade and demonstrates a near match to the black bar, except for some anticipated modest improvement over time, with slight decreases among those unlinked with concomitant increases in those suppressed. Bars in blue provide current cascade results over 5-year (light blue) and 10-year (dark blue) and further demonstrate modest improvements in the cascade. At 10 years, the current cascade shows 44% of those alive are virologically suppressed. UNAIDS Target strategy and Alternative UNAIDS Target strategy. This figure utilizes alternative input parameters (lower testing and linkage rates and higher rates of virologic suppression), compared to the UNAIDS Target strategy base case to achieve viral suppression goals in the Alternative UNAIDS Target strategy, without 81% of persons on ART. The hatched white bar on the far right demonstrates the aspirational 90-90-90 cascade with 73% virologically suppressed. Model output demonstrates 90-90-90 basecase results that might be achieved in 5 and 10 years (in light and dark green) and cascade states at 5 and 10 years in the Alternative UNAIDS Target strategy (light and dark purple). While the UNAIDS Target strategy and the Alternative UNAIDS Target strategy have similar viral suppression rates (~73%), they differ in the proportion of persons on ART (81% in the UNAIDS Target strategy and 75% in the Alternative UNAIDS Target strategy). The denominators (number alive) in these three strategies over time differ as a result of differences in the number of transmissions and deaths.
Figure 1
Figure 1. HIV treatment cascade by cascade strategy
This figure demonstrates the results of the HIV treatment cascade over time, examining the percent of patients alive (vertical axis) who are unlinked (undiagnosed or previously linked and now lost-to-follow-up), on ART, or virologically suppressed (horizontal axis). Current Pace strategy: The hatched black bar on the left demonstrates literature-derived data on the current South Africa cascade of care. The grey bar represents model-based results after 1 year of the current cascade and demonstrates a near match to the black bar, except for some anticipated modest improvement over time, with slight decreases among those unlinked and concomitant increases in those suppressed. Bars in blue provide Current Pace results over 5-year (light blue) and 10-year horizons (dark blue) and further demonstrate modest improvements in the cascade. At 10-years, the Current Pace shows 44% of those alive are virologically suppressed. UNAIDS Target strategy: The hatched white bar on the far right demonstrates the aspirational UNAIDS Target strategy with 73% virologically suppressed. Model output demonstrates UNAIDS Target strategy results that might be achieved in 5 years (light green). The screening, linkage, adherence and retention parameters of the model were adjusted to force the light green bars to reach 90-90-90 target values; we were able to achieve 80% of patients alive with virologic suppression in 10 years. Importantly, the denominators (number alive) in the two strategies over time differ due to an increased number of transmissions and deaths in the Current Pace strategy.
Figure 2
Figure 2. Comparison of survival outcomes over time by cascade strategy
This figure provides a side-by-side comparison of the cumulative outcomes over time between the Current Pace strategy (light bars) and the UNAIDS Target strategy (dark bars). The cumulative number of HIV-infected persons, including those who have died, is on the vertical axis. Black/gray shading indicate the number who have died; blue shading indicates the number who are undiagnosed and/or unlinked; orange shading indicates the number who are unsuppressed on ART; and green shading indicates the number who are suppressed on ART. The difference in the height of the bars in each year indicates the cumulative number of additional transmissions in the Current Pace strategy compared to the UNAIDS Target strategy.
Figure 3
Figure 3. Outcomes related to maternal orphans by cascade strategy
The vertical axis represents the number of maternal orphans (defined as children <18 years old whose mother has died of HIV/AIDS) over time (horizontal axis). Results from the Current Pace strategy are indicated by blue lines and results of the UNAIDS Target strategy are indicated by green lines. Cumulative orphans are denoted by the dashed lines, which demonstrate the cumulative number of children ever orphaned by HIV/AIDS during the time horizon of the analysis (see Methods). Solid lines indicate the projected number of current orphans in a given year, accounting for both death among orphans after orphanhood and for aging out of being considered an orphan. The kinks in the solid lines at year ~8 demonstrate the aging out of a large majority of prevalent orphans aged 9–14 years old at model initiation. The dotted lines indicate the number of living orphans <5 years old.

References

    1. 90-90-90: an ambitious treatment target to help end the AIDS epidemic. Geneva, Switzerland: Joint United Nations Programme on HIV/AIDS (UNAIDS); 2014. [Accessed March 30, 2016]. at http://www.unaids.org/sites/default/files/media_asset/90-90-90_en_0.pdf.
    1. Kranzer K, Lawn SD, Johnson LF, Bekker L-G, Wood R. Community viral load and CD4 count distribution among people living with HIV in a South African township: implications for treatment as prevention. J Acquir Immune Defic Syndr. 2013;63(4):498–505. - PMC - PubMed
    1. Piot P, Abdool Karim SS, Hecht R, Legido-Quigley H, Buse K, Stover J, et al. Defeating AIDS—advancing global health. Lancet. 2015;386(9989):171–218. - PubMed
    1. Long L, Fox M, Sanne I, Rosen S. The high cost of second-line antiretroviral therapy for HIV/AIDS in South Africa. AIDS. 2010;24(6):915–9. - PubMed
    1. Walensky RP, Ross EL, Kumarasamy N, Wood R, Noubary F, Paltiel AD, et al. Cost-effectiveness of HIV treatment as prevention in serodiscordant couples. N Engl J Med. 2013;369(18):1715–25. - PMC - PubMed

Publication types

MeSH terms

Substances