

Experimental and numerical analysis of B1(+) field and SAR with a new transmit array design for 7T breast MRI
- PMID: 27240143
- PMCID: PMC4979605
- DOI: 10.1016/j.jmr.2016.04.012
Experimental and numerical analysis of B1(+) field and SAR with a new transmit array design for 7T breast MRI
Abstract
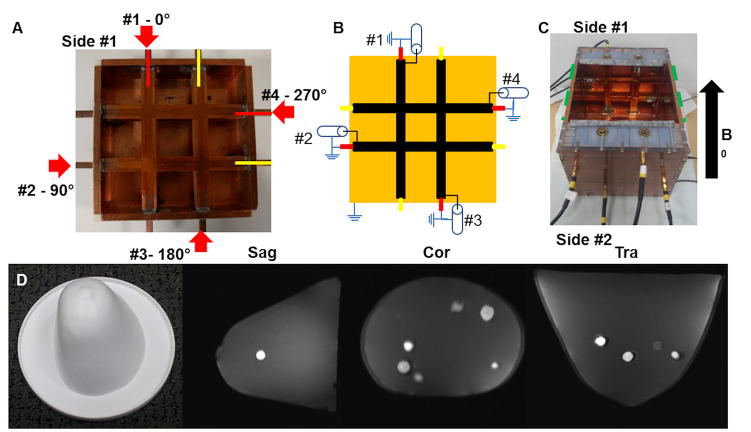
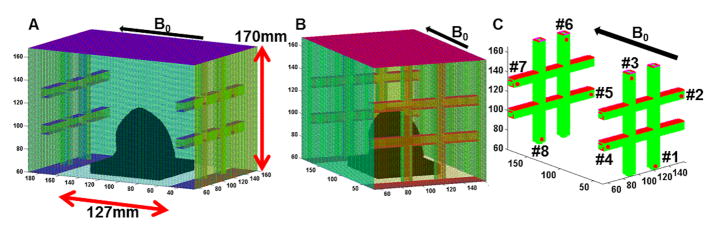
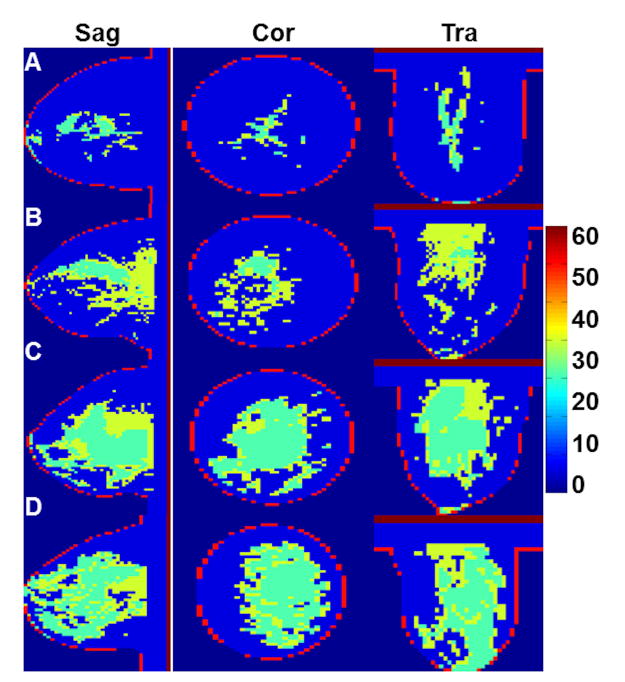
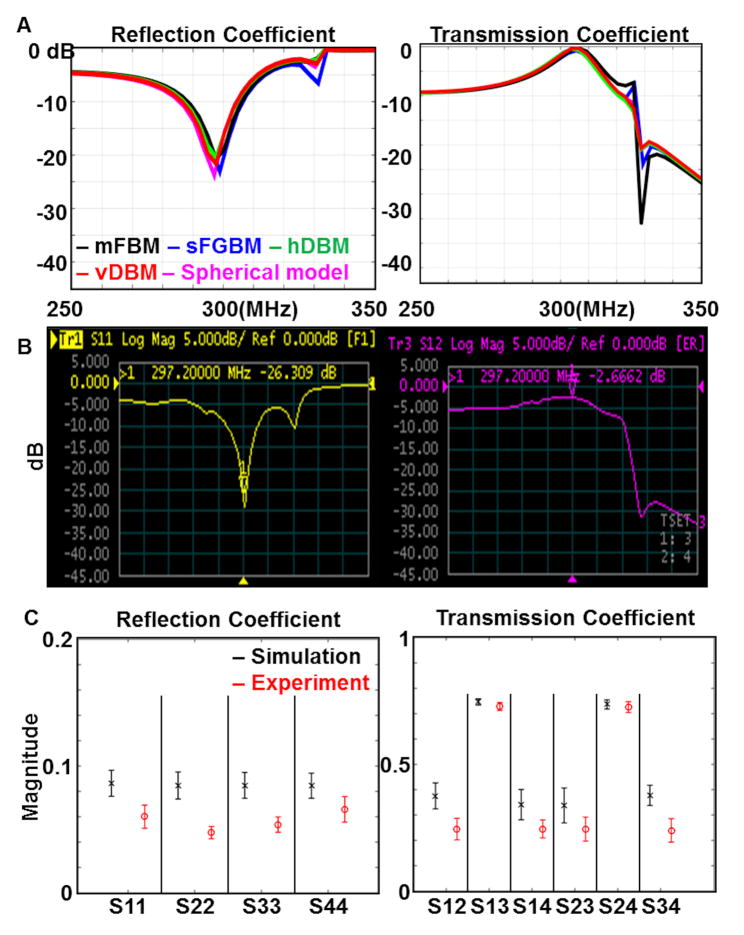
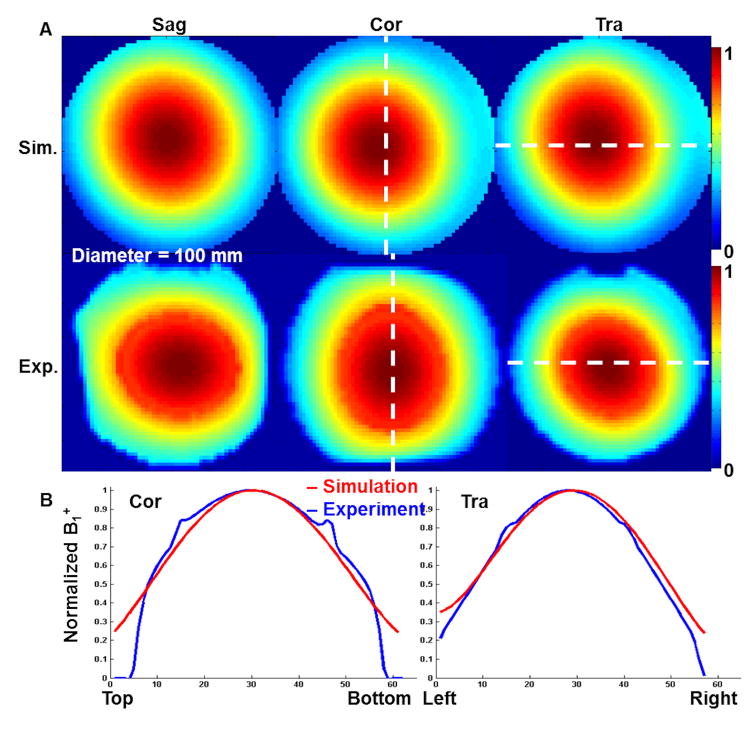
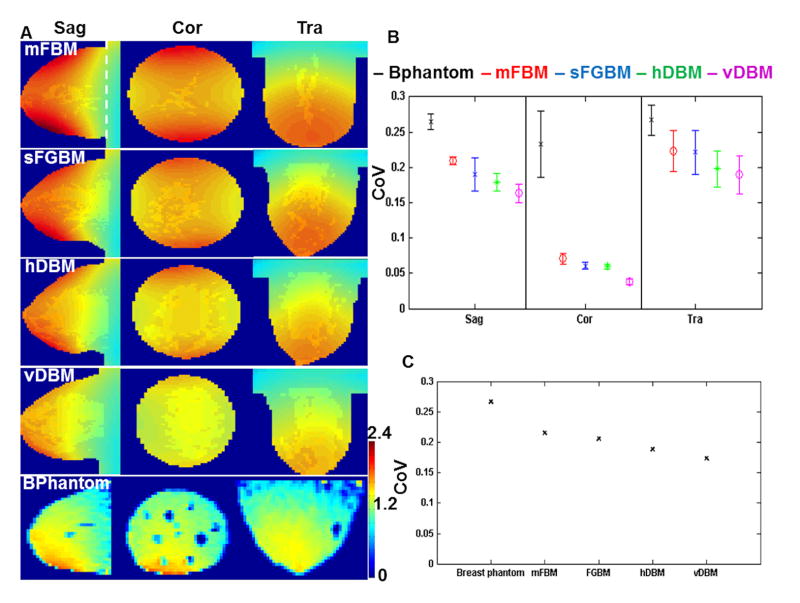
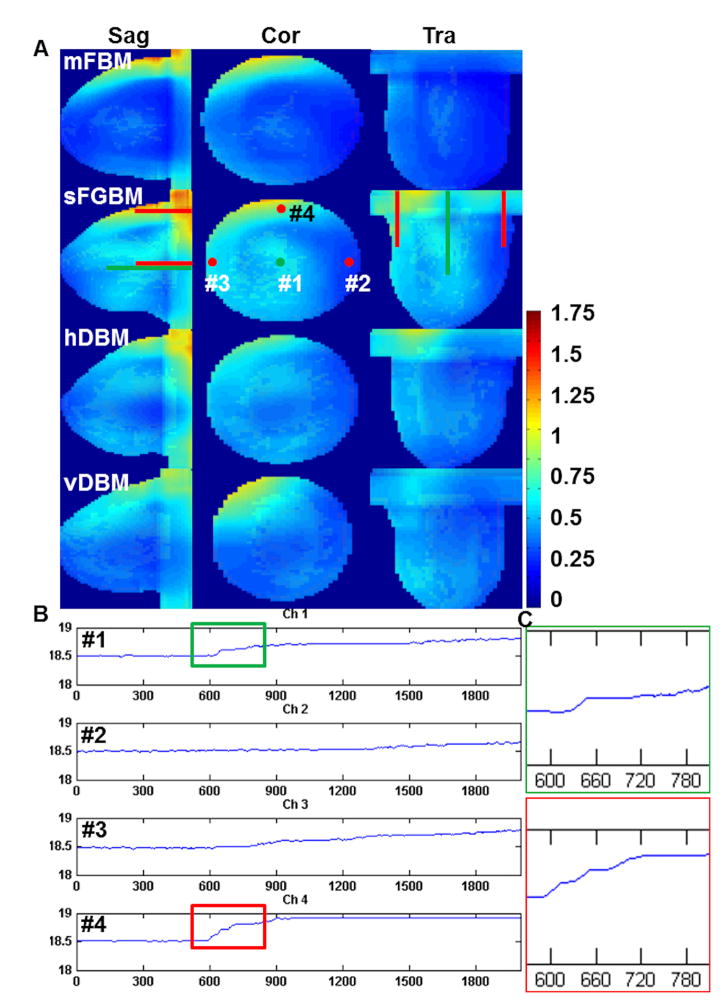
Developing a radiofrequency (RF) coil system that produces a uniform B1(+) field (circularly polarized component of the transverse magnetic field responsible for excitation) and low specific absorption rate (SAR) is critical for high performance ultrahigh field human imaging. In this study, we provide the design of a new eight channel radiofrequency (RF) transmit (Tx) array for breast MRI at 7T. A numerical analysis utilizing an in-house finite difference time domain (FDTD) package was carried out in (1) four breast models, (2) homogeneous spherical model and (3) full body model to calculate the B1(+) intensity (μT) and homogeneity represented by coefficient of variation (CoV=standard deviation/mean) in the proposed RF array design. The numerical results were compared with that measured in breast phantom (Bphantom) and homogeneous spherical phantom at 7T MRI and showed very good agreement. Average and peak SARs were also calculated in the four breast models and the temperature rises due to the operation of the RF array were also measured in the Bphantom. The proposed RF array; which can operate in a single or multi transmit modes, demonstrates homogeneous RF field excitation with acceptable local/average SAR levels for breast MRI at 7T.
Keywords: 7T; B(1)(+); Breast; FDTD; RF coil; SAR; Tx/Rx array.
Copyright © 2016 Elsevier Inc. All rights reserved.
Figures
Similar articles
-
Development of a 7 T RF coil system for breast imaging.NMR Biomed. 2017 Jan;30(1):10.1002/nbm.3664. doi: 10.1002/nbm.3664. Epub 2016 Nov 11. NMR Biomed. 2017. PMID: 27859861 Free PMC article.
-
In-vivo and numerical analysis of the eigenmodes produced by a multi-level Tic-Tac-Toe head transmit array for 7 Tesla MRI.PLoS One. 2018 Nov 27;13(11):e0206127. doi: 10.1371/journal.pone.0206127. eCollection 2018. PLoS One. 2018. PMID: 30481187 Free PMC article.
-
Fast and accurate multi-channel B1+ mapping based on the TIAMO technique for 7T UHF body MRI.Magn Reson Med. 2018 May;79(5):2652-2664. doi: 10.1002/mrm.26925. Epub 2017 Oct 9. Magn Reson Med. 2018. PMID: 28994132
-
Specific absorption rate (SAR) simulations for low-field (< 0.1 T) MRI systems.MAGMA. 2023 Jul;36(3):429-438. doi: 10.1007/s10334-023-01073-3. Epub 2023 Mar 18. MAGMA. 2023. PMID: 36933091 Free PMC article. Review.
-
[Safety of implants in high field and ultrahigh field MRI].Radiologe. 2019 Oct;59(10):898-905. doi: 10.1007/s00117-019-0556-z. Radiologe. 2019. PMID: 31172246 Review. German.
Cited by
-
Bridging Neuroimaging and Neuropathology: A Comprehensive Workflow for Targeted Sampling of White Matter Lesions.medRxiv [Preprint]. 2025 Jun 9:2025.06.08.25329217. doi: 10.1101/2025.06.08.25329217. medRxiv. 2025. PMID: 40585178 Free PMC article. Preprint.
-
Characterization of pulsations in the brain and cerebrospinal fluid using ultra-high field magnetic resonance imaging.Front Neurosci. 2024 May 9;18:1305939. doi: 10.3389/fnins.2024.1305939. eCollection 2024. Front Neurosci. 2024. PMID: 38784099 Free PMC article.
-
Brain Morphometrics Correlations With Age Among 350 Participants Imaged With Both 3T and 7T MRI: 7T Improves Statistical Power and Reduces Required Sample Size.Hum Brain Mapp. 2025 Mar;46(4):e70195. doi: 10.1002/hbm.70195. Hum Brain Mapp. 2025. PMID: 40083197 Free PMC article.
-
RF shimming strategy for an open 60-channel RF transmit 7T MRI head coil for routine use on the single transmit mode.Magn Reson Med. 2025 Oct;94(4):1804-1816. doi: 10.1002/mrm.30563. Epub 2025 May 20. Magn Reson Med. 2025. PMID: 40391665 Free PMC article.
-
Improved 7 Tesla transmit field homogeneity with reduced electromagnetic power deposition using coupled Tic Tac Toe antennas.Sci Rep. 2021 Feb 9;11(1):3370. doi: 10.1038/s41598-020-79807-9. Sci Rep. 2021. PMID: 33564013 Free PMC article.
References
-
- Azlan CA, et al. B1 transmission-field inhomogeneity and enhancement ratio errors in dynamic contrast-enhanced MRI (DCE-MRI) of the breast at 3T. Journal of Magnetic Resonance Imaging. 2010;31(1):234–239. - PubMed
-
- de Moortele V, et al. B1 destructive interferences and spatial phase patterns at 7 T with a head transceiver array coil. Magnetic resonance in medicine. 2005;54(6):1503–1518. - PubMed
-
- Diehl D, et al. B1 Homogenization at 3 T MRI using a 16 rung transmit array. Proceedings of the 13th Annual Meeting of ISMRM; Miami Beach, FL, USA. 2005.
-
- Ibrahim T, et al. Analysis of B1 field profiles and SAR values for multi-strut transverse electromagnetic RF coils in high field MRI applications. Physics in medicine and biology. 2001;46(10):2545. - PubMed
-
- van den Bergen B, et al. 7 T body MRI: B1 shimming with simultaneous SAR reduction. Physics in medicine and biology. 2007;52(17):5429. - PubMed
Publication types
MeSH terms
Grants and funding
LinkOut - more resources
Full Text Sources
Other Literature Sources
Medical
Miscellaneous
