. 2016 Jul;34(7):752-9.
doi: 10.1038/nbt.3576. Epub 2016 May 30.

An artificial niche preserves the quiescence of muscle stem cells and enhances their therapeutic efficacy

Affiliations

An artificial niche preserves the quiescence of muscle stem cells and enhances their therapeutic efficacy

Marco Quarta et al. Nat Biotechnol. 2016 Jul.

Abstract

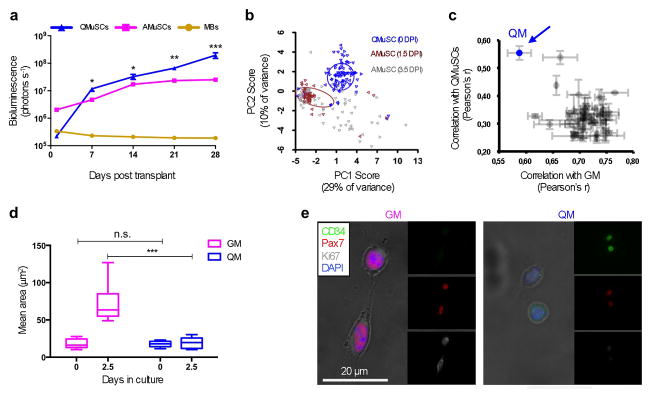
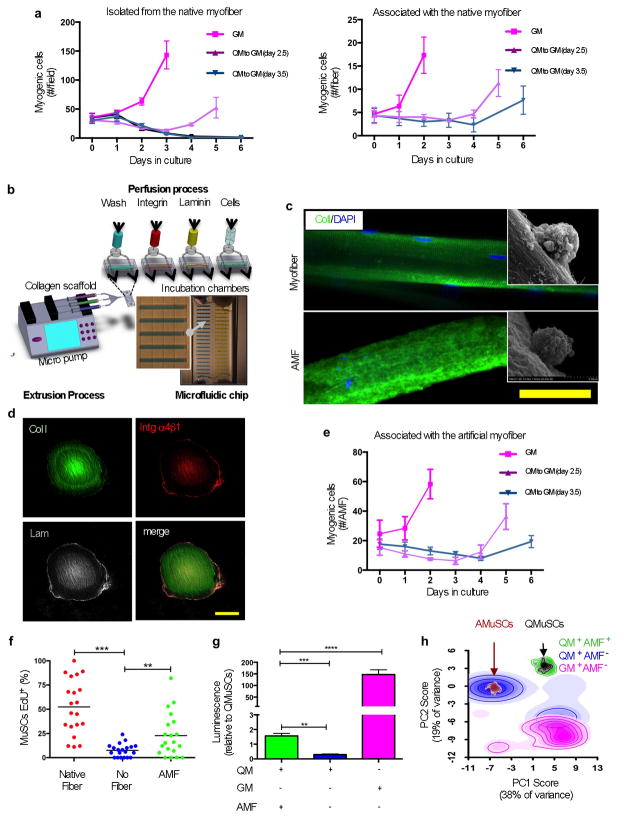
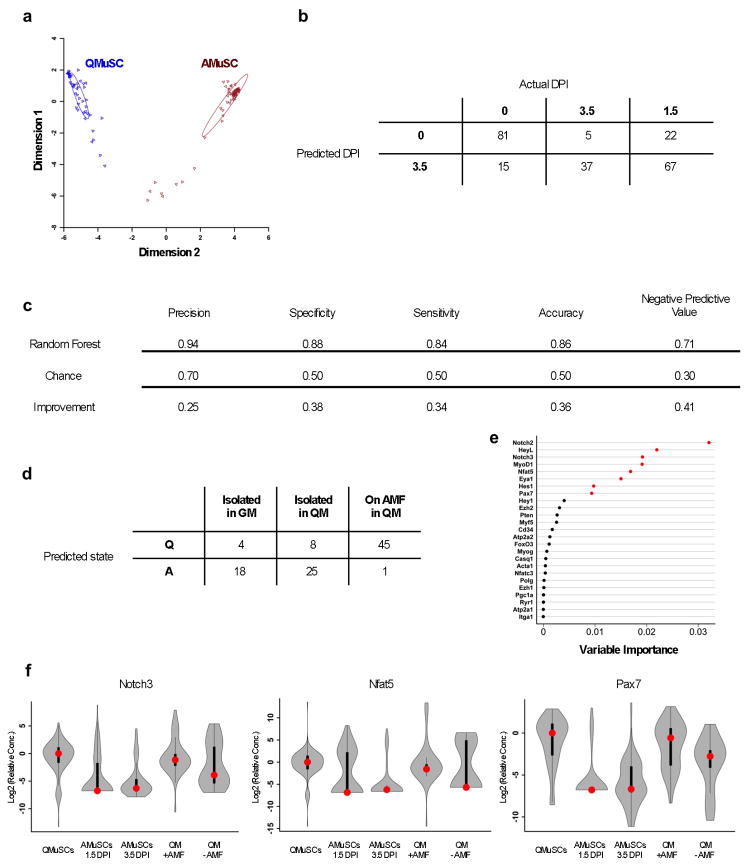
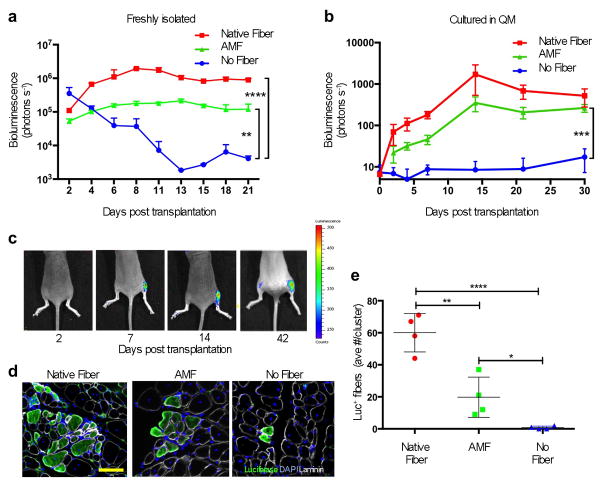
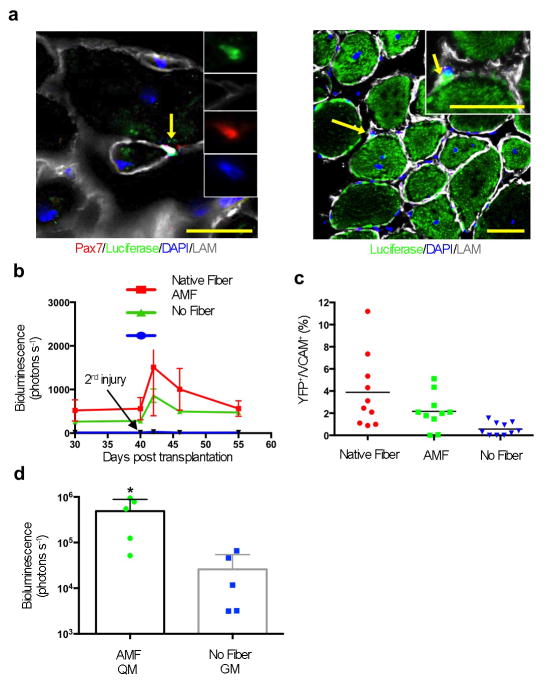
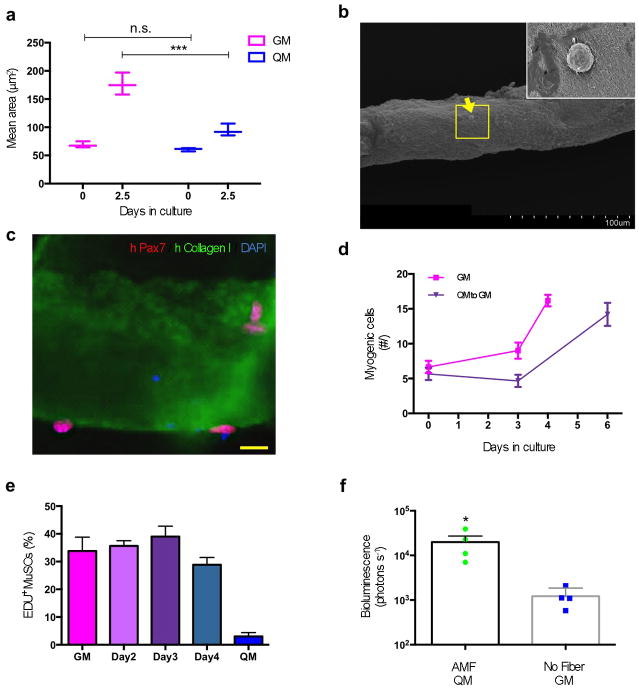
A promising therapeutic strategy for diverse genetic disorders involves transplantation of autologous stem cells that have been genetically corrected ex vivo. A major challenge in such approaches is a loss of stem cell potency during culture. Here we describe an artificial niche for maintaining muscle stem cells (MuSCs) in vitro in a potent, quiescent state. Using a machine learning method, we identified a molecular signature of quiescence and used it to screen for factors that could maintain mouse MuSC quiescence, thus defining a quiescence medium (QM). We also engineered muscle fibers that mimic the native myofiber of the MuSC niche. Mouse MuSCs maintained in QM on engineered fibers showed enhanced potential for engraftment, tissue regeneration and self-renewal after transplantation in mice. An artificial niche adapted to human cells similarly extended the quiescence of human MuSCs in vitro and enhanced their potency in vivo. Our approach for maintaining quiescence may be applicable to stem cells isolated from other tissues.


Conflict of interest statement

Competing Financial Interests Statement:

The authors declare no competing financial interests.

Figures

Figure 1
Figure 1. Formulation and functional characterization of “quiescence medium” (QM)
a. Non-invasive bioluminescence of transplanted myogenic cells. Mouse quiescent MuSCs (QMuSCs), activated MuSCs (AMuSCs) or cultured myoblasts (MBs) expressing luciferase were transplanted (10,000 cells per condition) in pre-injured TA muscles and host mice were imaged weekly using an IVIS in vivo bioluminescence imaging system for up to four weeks (n = 6, biological replicates). b. Analysis of single murine MuSC transcriptional profiles. Single freshly isolated MuSCs were isolated by FACS and compared for gene expression profiles using PCA. Single MuSCs were isolated from TA muscles at 0, 1.5, or 3.5 days post injury (DPI). Standard deviational ellipses (radius = 1 SD) are shown for 0 and 3.5 DPI. c. Analysis of combinatorial screening of quiescence-preserving molecules. The graph shows the correlation between transcriptional profiles generated for each group of 500 MuSCs grown in different combinations of the compounds tested. The combination that showed the highest correlation with QMuSCs (Y axis) and the lowest correlation with MuSCs cultured in GM (X axis) was the one chosen for the QM (colored in blue, indicated by the arrow). d. Quantification of the areas, assessed microscopically, of MuSCs cultured in either GM or QM immediately after isolation (0 days) or after 2.5 days in culture (n = 3, biological replicates). e. Representative immunofluorescence images of FACS isolated MuSCs cultured for 2.5 days in GM or QM.
Figure 2
Figure 2. Artificial muscle fibers support functional quiescence of MuSCs in vitro
a. Cultured mouse MuSCs in different media quantified at different time points. MuSCs that were freshly isolated by FACS (left panel) or isolated associated with single myofiber explants (right panel) were cultured in QM for different days before switching the medium to GM to assess their responsiveness to activate and proliferate. Myogenic cells are cells that stained positive with a cocktail of Pax7 and MyoD antibodies (n = 3, biological replicates). b. Schematic of the fabrication process of AMFs on a microfluidic chip. The design is based on arrays of 20 chambers (500 μm × 300 μm × 7 mm), with media inlet and outlet ports for fluidic lines constituted by 5 parallel channels (50 × 50 μm) used to exchange solutions and to perform cell seeding through the chambers. Monomers of Collagen I are extruded through a nozzle in the chambers to generate AMFs. c. Representative immunostaining of a single murine myofiber (top) and a single AMF (bottom). Scanning electron microscopy images (insets) show MuSCs localized on the fibers. Scale bar = 50 μm. d. Representative confocal immunofluorescence images of a functionalized AMF cross-section. Immunostaining was performed for Collagen I (green), Integrin α4β1 (red) and Laminin (grey). Scale bar = 50 μm. e. Quantification of mouse MuSCs cultured onto AMFs in different media at different time points. Freshly isolated MuSCs were associated with AMFs and cultured in QM or GM as in panel “a”. f. Quantification of MuSCs that were EdU+ve after switching QM to GM at day 3.5. Freshly isolated MuSCs, associated with a native fiber, associated with an AMF, or not associated with a fiber, were cultured in QM in the presence of EdU and switched to GM before being stained (n = 3, biological replicates). g. ATP level quantification measured in a bioluminescence assay. Cultured cells were analyzed and compared to freshly isolated quiescent MuSCs. Freshly isolated MuSCs, with or without being associated with AMFs, were cultured in QM or GM for 2.5 days before being analyzed (10,000 cells per condition from 3 biological replicates). h. PCA of single cell transcriptional profiles. Single MuSCs cultured, with or without being associated with AMFs, in different media were compared with freshly isolated quiescent or activated MuSCs. Clouds represent the densitometry of single cell distributions; colors indicate different cell populations.
Figure 3
Figure 3. Mouse MuSCs cultured in QM on AMFs are transcriptionally similar to quiescent MuSCs in vivo
a. Multidimensional scaling representation for the training dataset of single MuSC gene expression. The analysis is based on the proximity matrix of the proportion of trees in which cell pairs share terminal nodes. b. Generation of a random forest model for single MuSCs. After combinatorial Q-RT-PCR on single cells, random forest construction was performed using the gene expression profiles of 48 cells 0 DPI and 68 cells 3.5 DPI. c. Cross-validation dataset. Data are analyzed from a separate experiment, which also included 1.5 DPI cells, to validate the random forest performance in predicting and recognizing the MuSC quiescent or activated state. d. Classification of cells in three conditions (isolated and grown in GM; isolated and grown in QM; associated with AMFs and grown in QM) as being in either a “quiescent” or an “activated” state based on the single cell gene expression profile of individual MuSCs. After this model construction and validation, single cells from one of three culture conditions (GM, QM, or AMF+QM) were classified as 0 DPI (“Q”) or 3.5 DPI (“A”). e. Loadings for genes expressed in single MuSCs. The analysis was performed after combinatorial Q-RT-PCR on cells 0 DPI (for quiescent MuSCs) or on cells 1.5 or 3.5 DPI (for activated MuSCs). The most important genes whose expression is correlated with and predictive of the quiescent state are shown in red. f. Violin plots for selected genes expressed in single MuSCs. The graphs compare the results from single MuSCs obtained in different conditions in vivo (QMuSCs; AMuSCs 1.5 DPI; AMuSCs 3.5 DPI) and in vitro (QM + AMF; QM − AMF). Red dots represent the median. Black bars represent the first and third quartiles. Whiskers represent the minimum and maximum within 1.5 interquartile distances of the first or third quartile.
Figure 4
Figure 4. Transplant potency enhancement via the artificial niche
a. Results of non-invasive in vivo bioluminescence imaging of freshly isolated, transplanted mouse MuSCs. MuSCs (100 cells per condition) were isolated and immediately transplanted into pre- injured TA muscles: 1) still associated with native myofibers; 2) isolated by FACS and plated onto AMFs in vitro prior to transplantation; or 3) isolated by FACS and in suspension (n ≥ 4, biological replicates). b. Results of non-invasive in vivo bioluminescence of pre-cultured, transplanted MuSCs. MuSCs were cultured for 2.5 days in QM, associated or not with a fiber as in panel “a”, prior to transplantation (50 cells per condition) and imaged weekly for one month (n = 5, biological replicates). c. Representative bioluminescence images of a time course analysis of one of the host mice, quantified as in panel “b”, that received 50 MuSCs transplanted in each TA muscles. The right leg (which is on the right side since the mouse is prone in each image) received MuSCs associated with AMFs; the left leg received MuSCs not associated with any fiber. Images were obtained at different time points as indicated (bioluminescence values are indicated as photons cm−2 s−1 on the scale to the right). d. Representative immunofluorescence immunohistochemistry (IF-IHC) of Luciferase expression in TA muscle cross sections. Muscles of the mice imaged and quantified in panels “b” and “c” were isolated 40 days after transplantation. Scale bars = 100 μm. e. Quantification of IF-IHC staining for Luciferase+ve fibers per cluster in TA muscles that were recipients of transplanted MuSCs. The average number of fibers per cluster per TA is shown; the number of clusters/TA was: Native Fibers 4.6±1.02; AMF 2.6±1.02; No Fiber 0.4±0.48.
Figure 5
Figure 5. AMF maintains MuSC self-renewal capacity after in vitro manipulations
a. IF-IHC staining of TA muscles transplanted with mouse MuSCs associated with AMFs showing representative images of transplanted Luciferase+ve MuSCs (Luciferase+ve MuSCs localized in between Luciferase+ve fibers are indicated by arrows and magnified in the insets). Scale bars = 100 μm. b. Results of non-invasive in vivo bioluminescence imaging of muscles that were recipient of transplanted Luciferase+ve MuSCs and re-injured after 40 days (indicated by the arrow) after the transplantation. The second injury was performed to test if the bioluminescence signal increased as a consequence of activating and expanding Luciferase+ve MuSCs that were initially transplanted and that had engrafted under the basal lamina (n ≥ 4, biological replicates). c. Quantification of the number of transplanted MuSCs expressing YFP that engrafted as stem cells. Cells were isolated and cultured in QM prior to transplantation in TA muscles. An injury was induced 40 days after transplantation. Ten days later, the percentage of MuSCs (VCAM+ve) that were donor- derived (YFP+ve) was assessed by FACS. d. Results of non-invasive in vivo bioluminescence imaging of transduced and transplanted MuSCs. Isolated MuSCs were either cultured in QM while associated with AMFs or cultured in GM alone for 3.5 days. During culturing, cells were transduced with a lentivirus expressing Luciferase, and 1,000 cells were then transplanted into pre-injured TA muscles. Recipient mice were imaged by bioluminescence 30 days later.
Figure 6
Figure 6. Artificial niche preserves the potency of human MuSCs
a. Quantification of the areas, assessed microscopically, of hMuSCs cultured in either GM or QM immediately after isolation (0 days) or after 2.5 days in culture (n = 3, biological replicates). b. Scanning electron microscopy images show hMuSC (indicated by yellow arrow) localized on a human AMF. Scale bar = 100 μm. The yellow box is magnified (inset) to show the hMuSC. c. Immunostaining of a single human AMF seeded with hMuSCs. Scale bar = 10 μm. d. Reversible quiescence of hMuSCs cultured on AMFs in QM. Freshly isolated hMuSCs were associated with AMFs and cultured in QM before switching to GM (as in Fig. 2a). e. Quantification of hMuSCs that were EdU+ve after switching QM to GM at 2.5 days. Freshly isolated hMuSCs, associated with AMFs, were cultured in QM and switched to GM, pulsing EdU for 24 hours before being stained (n=3, biological replicates). f. Results of non-invasive in vivo bioluminescence imaging of transduced and transplanted hMuSCs. Similar to experiments of Fig. 5d, isolated hMuSCs were transduced to express Luciferase then either cultured in QM while associated with AMFs or cultured in GM alone for 3.5 days and then transplanted into TA muscles.

Comment in

Similar articles

Cited by

References

    1. Montarras D, et al. Direct isolation of satellite cells for skeletal muscle regeneration. Science. 2005;309:2064–2067. - PubMed
    1. Sacco A, Doyonnas R, Kraft P, Vitorovic S, Blau HM. Self-renewal and expansion of single transplanted muscle stem cells. Nature. 2008;456:502–506. - PMC - PubMed
    1. Cerletti M, et al. Highly efficient, functional engraftment of skeletal muscle stem cells in dystrophic muscles. Cell. 2008;134:37–47. - PMC - PubMed
    1. Li L, Clevers H. Coexistence of quiescent and active adult stem cells in mammals. Science. 2010;327:542–545. - PMC - PubMed
    1. Fuchs E. The tortoise and the hair: slow-cycling cells in the stem cell race. Cell. 2009;137:811–819. - PMC - PubMed

Publication types

Substances