

The Knowledge Base for Achieving the Sustainable Development Goal Targets on Water Supply, Sanitation and Hygiene
- PMID: 27240389
- PMCID: PMC4923993
- DOI: 10.3390/ijerph13060536
The Knowledge Base for Achieving the Sustainable Development Goal Targets on Water Supply, Sanitation and Hygiene
Abstract
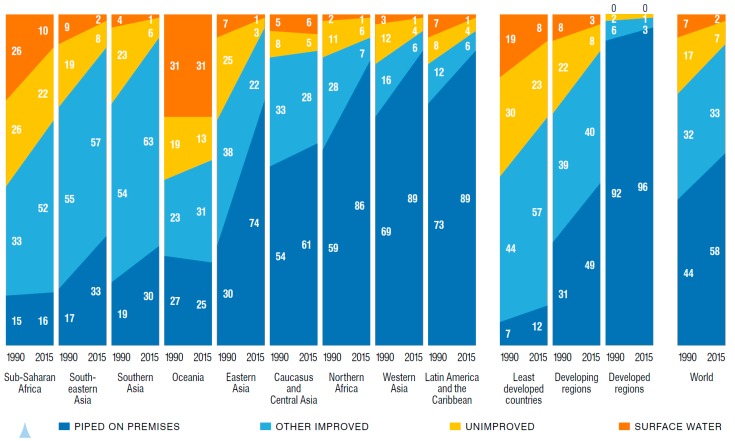
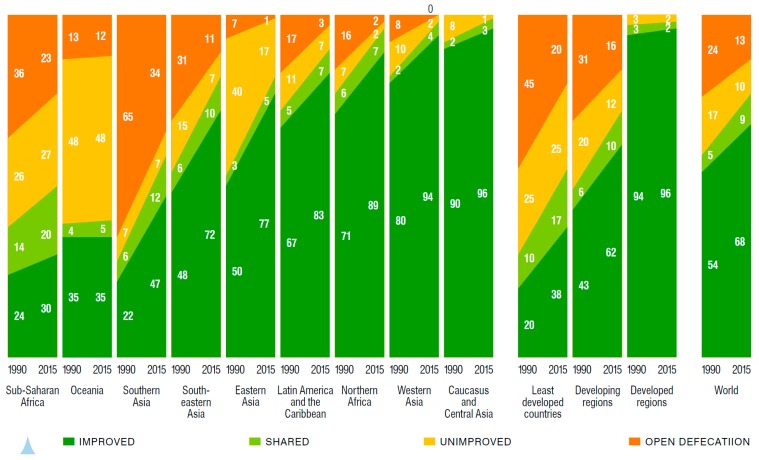
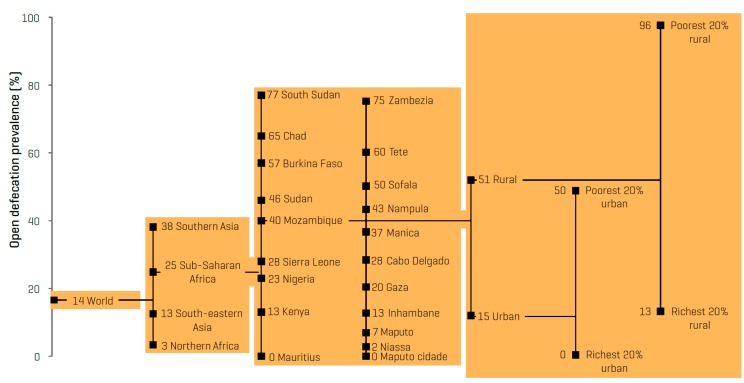
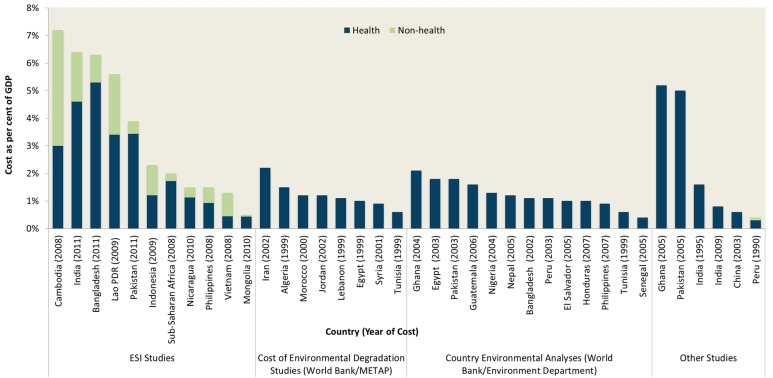
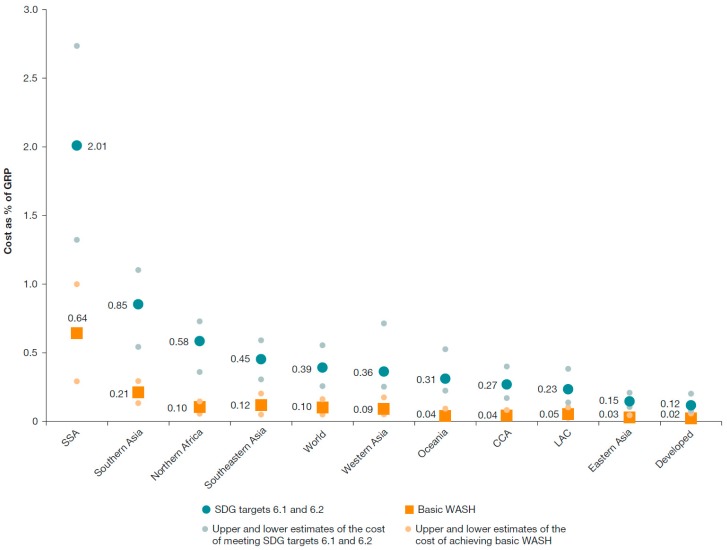
Safe drinking water, sanitation, and hygiene (WASH) are fundamental to an improved standard of living. Globally, 91% of households used improved drinking water sources in 2015, while for improved sanitation it is 68%. Wealth disparities are stark, with rural populations, slum dwellers and marginalized groups lagging significantly behind. Service coverage is significantly lower when considering the new water and sanitation targets under the sustainable development goals (SDGs) which aspire to a higher standard of 'safely managed' water and sanitation. Lack of access to WASH can have an economic impact as much as 7% of Gross Domestic Product, not including the social and environmental consequences. Research points to significant health and socio-economic consequences of poor nutritional status, child growth and school performance caused by inadequate WASH. Groundwater over-extraction and pollution of surface water bodies have serious impacts on water resource availability and biodiversity, while climate change exacerbates the health risks of water insecurity. A significant literature documents the beneficial impacts of WASH interventions, and a growing number of impact evaluation studies assess how interventions are optimally financed, implemented and sustained. Many innovations in behavior change and service delivery offer potential for scaling up services to meet the SDGs.
Keywords: cost-benefit; cost-effectiveness; economic analysis; environment; health; hygiene; nutrition; sanitation; water; water security.
Figures
References
-
- Human Rights Council Resolution Adopted by the Human Rights Council. 18/1. The Human Right to Safe Drinking Water and Sanitation. [(accessed on 29 February 2016)]. Available online: http://www.worldwatercouncil.org/fileadmin/wwc/Right_to_Water/Human_Righ....
-
- WHO. UNICEF . Post 2015 Wash Targets and Indicators. WHO; Geneva, Switzerland: UNICEF; New York, NY, USA: 2013. WHO/UNICEF Joint Monitoring Programme for Water Supply and Sanitation.
-
- World Health Organization. UNICEF . Rapid Assessment of Drinking-Water Quality (Radwq). A Handbook for Implementation. World Health Organization; Geneva, Switzerland: UNICEF; New York, NY, USA: 2012.
-
- World Health Organization. UNICEF . Meeting the MDG Drinking Water and Sanitation Target. The Urban and Rural Challenge of the Decade. WHO; Geneva, Switzerland: UNICEF; New York, NY, USA: 2006. WHO/UNICEF Joint Monitoring Programme for Water Supply and Sanitation.
-
- Roaf V., Khalfan A., Langford M. Monitoring Implementation of the Right to Water: A Framework for Developing Indicators. Heinrich Böll Foundation; Berlin, Germany: 2005.
Publication types
MeSH terms
LinkOut - more resources
Full Text Sources
Other Literature Sources
