. 2017 Jun;22(6):836-849.
doi: 10.1038/mp.2016.84. Epub 2016 May 31.

Chromosomal contacts connect loci associated with autism, BMI and head circumference phenotypes

Collaborators, Affiliations

Chromosomal contacts connect loci associated with autism, BMI and head circumference phenotypes

M N Loviglio et al. Mol Psychiatry. 2017 Jun.

Abstract

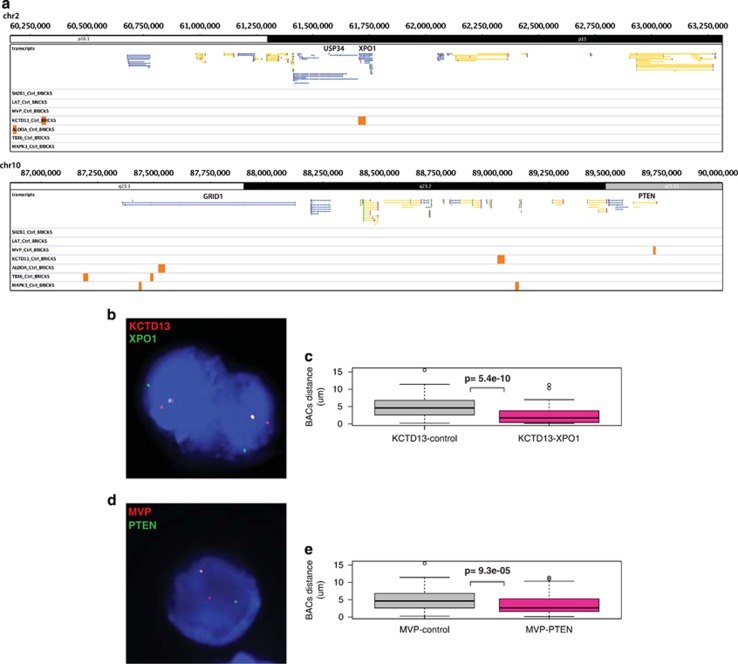
Copy number variants (CNVs) are major contributors to genomic imbalance disorders. Phenotyping of 137 unrelated deletion and reciprocal duplication carriers of the distal 16p11.2 220 kb BP2-BP3 interval showed that these rearrangements are associated with autism spectrum disorders and mirror phenotypes of obesity/underweight and macrocephaly/microcephaly. Such phenotypes were previously associated with rearrangements of the non-overlapping proximal 16p11.2 600 kb BP4-BP5 interval. These two CNV-prone regions at 16p11.2 are reciprocally engaged in complex chromatin looping, as successfully confirmed by 4C-seq, fluorescence in situ hybridization and Hi-C, as well as coordinated expression and regulation of encompassed genes. We observed that genes differentially expressed in 16p11.2 BP4-BP5 CNV carriers are concomitantly modified in their chromatin interactions, suggesting that disruption of chromatin interplays could participate in the observed phenotypes. We also identified cis- and trans-acting chromatin contacts to other genomic regions previously associated with analogous phenotypes. For example, we uncovered that individuals with reciprocal rearrangements of the trans-contacted 2p15 locus similarly display mirror phenotypes on head circumference and weight. Our results indicate that chromosomal contacts' maps could uncover functionally and clinically related genes.


Conflict of interest statement

The authors declare no conflict of interest.

Figures

Figure 1
Figure 1
The 16p11.2 region and its 4C interactions profile (panels from top to bottom). Transcripts: The transcripts mapping within the human chromosome 16 GRCh37/hg19 27–31 Mb region are indicated. The 4C-targeted SH2B1, LAT, MVP, KCTD13, ALDOA, TBX6 and MAPK3 genes are highlighted in red. Segmental duplications/viewpoints: The duplicated regions containing the low-copy repeats (LCR) that flank these rearrangements telomerically and centromerically are shown, whereas the position of the restrictions fragments used as viewpoints are marked with red ticks. CNVs: The position of the 600 kb BP4-BP5 (orange) and 220 kb BP2-BP3 intervals (blue) are depicted. Brain/LCLs: The mean z-score for transcript expression per group (Brain or LCLs) from GTEx is displayed. The corresponding RNA-seq heatmap color legend is showed at the bottom left corner. PC/BRICKs: Smoothed and profile-corrected 4C signal (upper part of each panel) and BRICKs (lower part) identified for each of the seven 4C viewpoints within the 16p11.2 cytoband, that is, from top to bottom SH2B1, LAT, MVP, KCTD13, ALDOA, TBX6 and MAPK3. The corresponding BRICKs significance heatmap color legend is showed at the bottom right corner.
Figure 2
Figure 2
Phenotypic characterization of carriers of 16p11.2 BP2-BP3 and 2p15 rearrangements. Distribution of Z-score values of BMI (a) and head circumference (b) in unrelated carriers of the 16p11.2 220 kb BP2-BP3 deletion (red) and duplication (blue) taking into account the normal effect of age and gender observed in the general population as described in Jacquemont et al. The general population has a mean of zero. (c) Comparison of the genomic breakpoints of 2p15 deletions (red bars) and duplications (blue bars) in 26 and 9 unrelated carriers, respectively. The breakpoints’ coordinates are detailed in Supplementary Table S2. The genes mapping within the interval and cytobands’ positions are shown above, while the extent of the critical region is indicated by a black bar. Distribution of Z-score values of BMI (d) and head circumference (e) in carriers of the 2p15 deletion (red) and duplication (blue).
Figure 3
Figure 3
Chromatin interactions between the 16p11.2 600 kb BP4-BP5 and 220 kb BP2-BP3 genomic intervals. (a) Circos plot representation of the chromatin loops identified in the human chromosome 16 27.5–31.0 Mb window. The 220 kb BP2-BP3 and 600 kb BP4-BP5 intervals are depicted by blue and orange bars on the peripheral circle, respectively. Darker sections indicated the positions of the viewpoints. Central blue and orange lines indicate the chromatin interactions corresponding to BP2-BP3 and BP4-BP5 viewpoints, respectively. Note the quasi absence of loops between the BP2-BP3 viewpoints (LAT and SH2B1) and the 27.5-28.4 Mb region. The mapping position of the KIAA0556 gene, used as control locus in fluorescence in situ hybridization experiments, is indicated. (b) High-resolution Hi-C chromosome conformation capture results obtained in reference with the GM12878 LCL within the chromosome 16 0–34 Mb window (left panels) and zoom in within the 28–31 Mb region encompassing the two CNVs (5 kb resolution; right panels). The positions of the 220 kb BP2-BP3 and 600 kb BP4-BP5 intervals are shown by blue and orange bars, respectively. Observed (top panel), observed/expected (central panel) and Pearson correlation results are presented (bottom panel). (c) Fluorescence in situ hybridization experiments show colocalization of SH2B1 foci (green) that map to the 220 kb BP2-BP3 interval with ALDOA foci (red) that map to the 600 kb BP4-BP5 genomic interval (left panel) but not with the equidistant KIAA0556 (red) foci (central panel). The distribution of interphase nuclei distances between the SH2B1 and ALDOA (deep pink) and SH2B1 and KIAA0556 foci (gray) are shown in the lower panel. The mapping positions of ALDOA, SH2B1 and KIAA0556 are indicated in (a).
Figure 4
Figure 4
Extensive overlap between differentially expressed genes and loci that show modified chromatin interactions. (a) Top panel: weighted Venn diagram showing the overlap between the 2209 genes that are differentially expressed in 16p11.2 rearrangement carriers (DE, yellow disk; FDR⩽5%), the 1193 genes that show modified chromatin interactions in 16p11.2 rearrangement carriers (4C-modified, purple disk; only 665 with detectable expression are considered for the DE enrichment; see Supplementary Table S31) and the 604 genes listed in SFARI Gene (https://sfari.org/; 323 expressed), an annotated list of candidate genes for ASD (ASD; blue disk). The numbers of common genes are indicated and the 12 4C-modified, DE and ASD-SFARI genes are specified on the right. Bottom panels: weighted Venn diagrams showing the overlap between the DE genes and the LCLs-expressed ASD and 4C-modified genes (lower left and right, respectively). (b) Circos plot representation of the modified chromatin loops identified in human chromosomes 16 and 22 (right-hand panel). The 220 kb BP2-BP3 and 600 kb BP4-BP5 intervals are depicted by blue and orange bars on the peripheral circle, respectively. Central blue and orange lines indicate the CNVs-modified chromatin interactions corresponding to BP2-BP3 and BP4-BP5 viewpoints, respectively. Ticks on the three internal rings indicate BRICKS with significantly modified interactions between 16p11.2 600 kb BP4-BP5 duplication and control samples (light blue ring), between 16p11.2 600 kb BP4-BP5 deletion and control samples (dark gray), and between 16p11.2 600 kb BP4-BP5 deletion and duplication samples (yellow). Blue and red ticks on the most external rings denote genes differentially expressed in 16p11.2 patients (DE) and SFARI-ASD-associated genes (ASD), respectively. A zoomed-in view with examples of genes with modified chromatin interactions mapping within the 22q13 cytoband is presented in the left-hand panel. (c) The 1193 genes that show modified chromatin interaction in 16p11.2 cells with 16p11.2 600 kb BP4-BP5 rearrangements encode proteins that interact. The confidence view interaction network of the encoded proteins corresponding to the enriched GO terms (GO:0030030 cell projection organization, GO:0042995 cell projection, GO:0030173 integral to Golgi membrane, GO:0000138 Golgi trans cisterna, GO:0034504 protein localization to nucleus and GO:0005874 microtubule) is visualized with STRING. Proteins belonging to cell projection (blue), microtubule (red), Golgi apparatus (green), stereocilium bundle (purple) and cilium (yellow) process/cell components are highlighted by colored beads. Disconnected nodes are not shown. FDR, false discovery rate.
Figure 5
Figure 5
Examples of 16p11.2 viewpoints chromatin-contacted regions. (a) Examples of regions (BRICKS) interacting with 16p11.2 viewpoints showing some of the contacted genes, that is, GRID1, PTEN and USP34/XPO1. Other examples (CHD1L and EP300) are shown in Supplementary Figure S8). Fluorescence in situ hybridization experiments show colocalization of the 600 kb BP4-BP5 interval-encompassed KCTD13 (red) and 2p15-mapping XPO1 foci (green) (b) and the 600 kb BP4-BP5 interval-encompassed MVP (red) and 10q23.31-mapping PTEN foci (green) (d). The distribution of interphase nuclei distances between KCTD13 and XPO1 (c) and between MVP and PTEN (e) foci are compared with to those between KCTD13/MVP and MARK4 (control) foci (25 and 14% co-localization versus 2% with the control locus; Fisher’s test enrichment: P=6.9e−05 and P=0.01, respectively; median MVP/KCTD13-USP34/XPO1 distances=1.76, MVP/KCTD13-PTEN=2.61 and MVP/KCTD13-MARK4=4.96 μm; Wilcoxon rank-sum test, P=5.4e−10 and P=9.3e−05, respectively).

References

    1. de Laat W, Duboule D. Topology of mammalian developmental enhancers and their regulatory landscapes. Nature 2013; 502: 499–506. - PubMed
    1. Fanucchi S, Shibayama Y, Burd S, Weinberg MS, Mhlanga MM. Chromosomal contact permits transcription between coregulated genes. Cell 2013; 155: 606–620. - PubMed
    1. Lupianez DG, Kraft K, Heinrich V, Krawitz P, Brancati F, Klopocki E et al. Disruptions of topological chromatin domains cause pathogenic rewiring of gene-enhancer interactions. Cell 2015; 161: 1012–1025. - PMC - PubMed
    1. Lupianez DG, Spielmann M, Mundlos S. Breaking TADs: how alterations of chromatin domains result in disease. Trends Genet 2016; 32: 225–237. - PubMed
    1. Johnson ME, Viggiano L, Bailey JA, Abdul-Rauf M, Goodwin G, Rocchi M et al. Positive selection of a gene family during the emergence of humans and African apes. Nature 2001; 413: 514–519. - PubMed

Publication types

MeSH terms