. 2016 May 31:6:26876.
doi: 10.1038/srep26876.

Smoothened Agonist Reduces Human Immunodeficiency Virus Type-1-Induced Blood-Brain Barrier Breakdown in Humanized Mice

Affiliations

Smoothened Agonist Reduces Human Immunodeficiency Virus Type-1-Induced Blood-Brain Barrier Breakdown in Humanized Mice

Vir B Singh et al. Sci Rep. .

Abstract

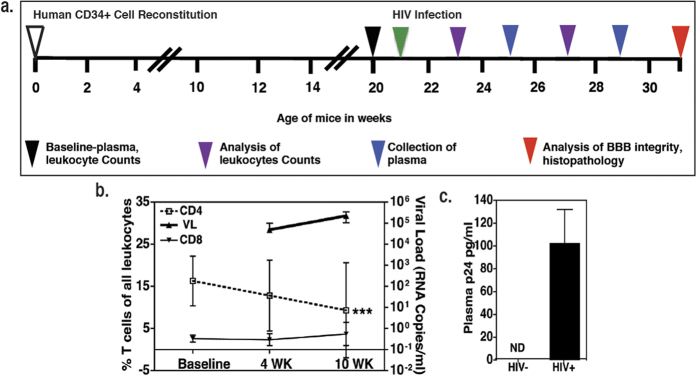
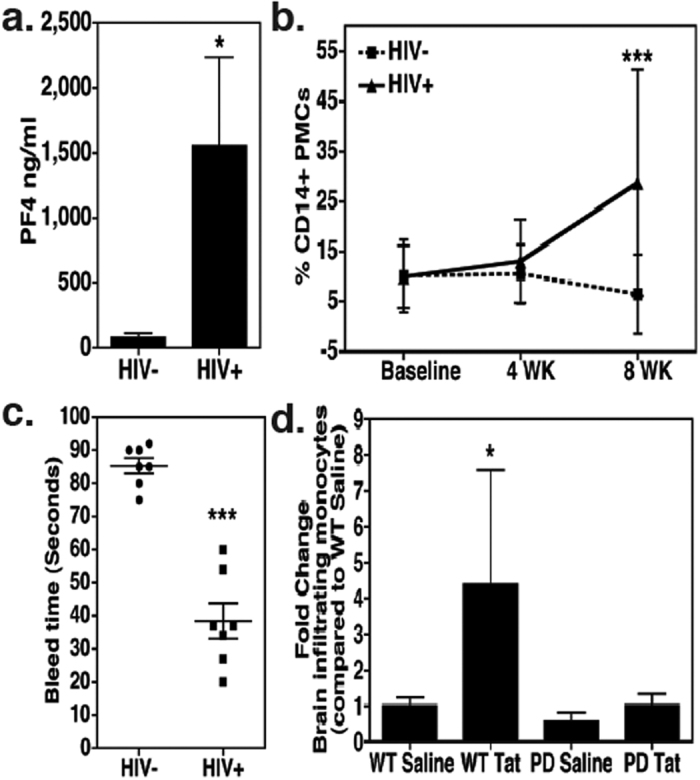
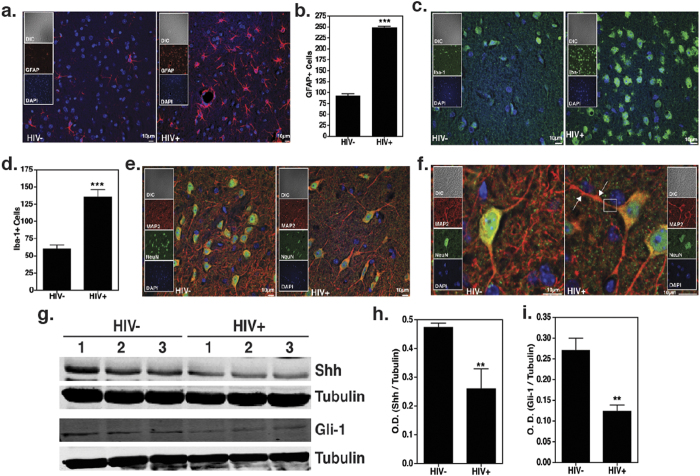
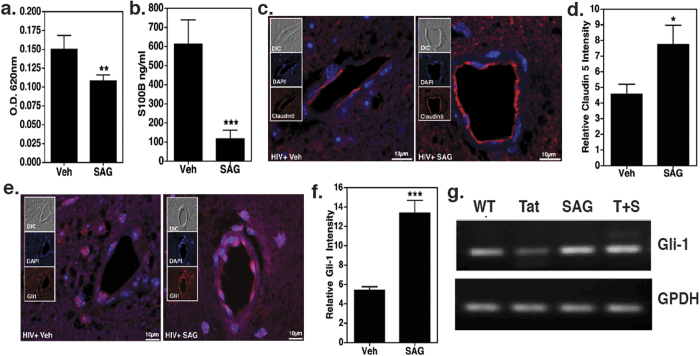
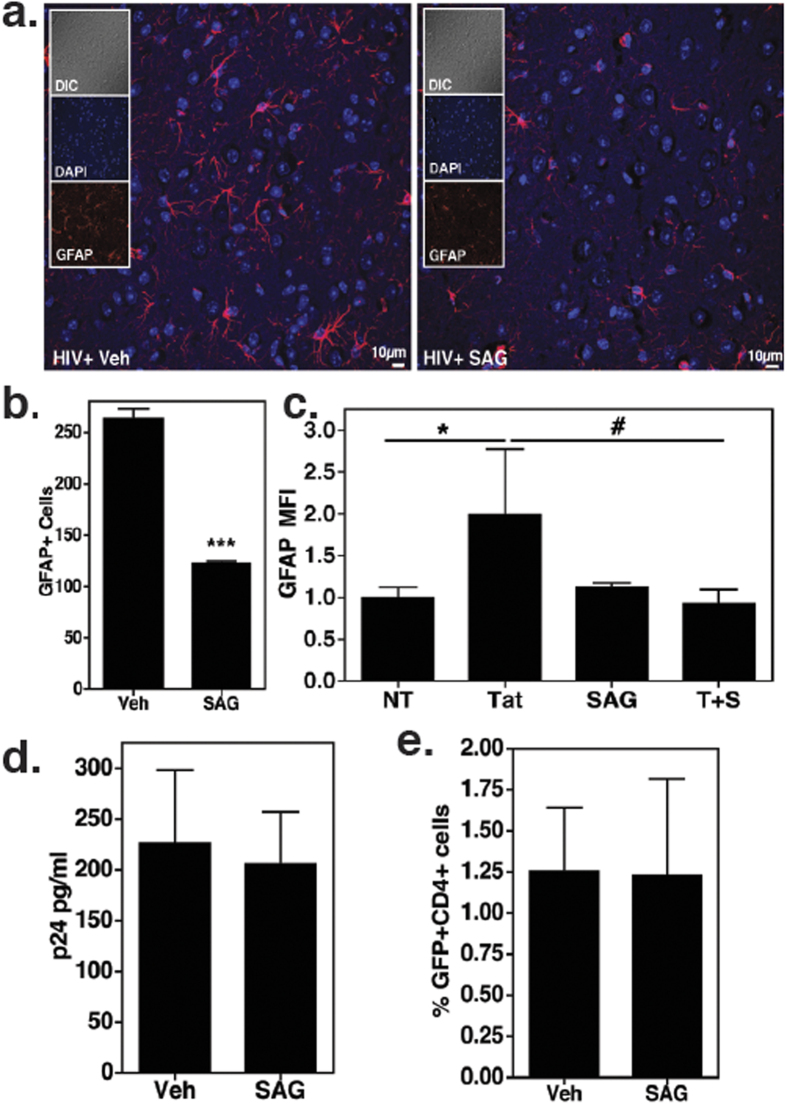
Human Immunodeficiency Virus type-1 (HIV)-associated neurocognitive disorder is characterized by recruitment of activated/infected leukocytes into the CNS via disrupted Blood Brain Barrier (BBB) that contributes to persistent neuro-inflammation. In this report, humanized NOD/scid-IL2Rγc(null) mice were used to establish that impaired Sonic hedgehog (Shh) signaling is associated with loss of BBB function and neurological damage, and that modulating Shh signaling can rescue these detrimental effects. Plasma viral load, p24 levels and CD4(+) T cells were measured as markers of productive HIV infection. These mice also showed impaired exclusion of Evans blue dye from the brain, increased plasma levels of S100B, an astrocytic protein, and down-regulation of tight junction proteins Occludin and Claudin5, collectively indicating BBB dysfunction. Further, brain tissue from HIV(+) mice indicated reduced synaptic density, neuronal atrophy, microglial activation, and astrocytosis. Importantly, reduced expression of Shh and Gli1 was also observed in these mice, demonstrating diminished Shh signaling. Administration of Shh mimetic, smoothened agonist (SAG) restored BBB integrity and also abated the neuropathology in infected mice. Together, our results suggest a neuroprotective role for Shh signaling in the context of HIV infection, underscoring the therapeutic potential of SAG in controlling HAND pathogenesis.


Figures

Figure 1
Figure 1. Progressive HIV infection of humanized mice.
(a) Experimental scheme for human CD34+ cell reconstitution, HIV infection, and time frame of observations. (b) CD4+, CD8+ T cell percentages (N=8 per time point per group) and plasma viral load at 4 and 10 w.p.i. in HIV infected (N = 3 per time point per group). ***denotes P < 0.0001 as compared to CD4+ T cell percentages at baseline (c) HIV protein p24 ELISA at 10 w.p.i. (N = 4 per group).
Figure 2
Figure 2. HIV infection induces platelet activation.
(a) Plasma human PF4 levels in humanized mice measured by ELISA (N = 4 per group). (b) Detection of platelet-monocyte complexes (PMCs) at 4 and 8 w.p.i. in HIV-infected and uninfected humanized mice by Flow Cytometry (N = 8 per time point per group). (c) Tail bleed assays were performed 10 w.p.i. (N = 7 per group). (d) Platelet-depleted mice (N = 4) were exposed to Tat (1.5 μg/g body weight) for total 24h and migration of GFP+ monocytes (derived from CX3CR1/GFP TG mice) into the CNS was measured by flow cytometry. As shown here, Tat-induced migration of GFP+ monocytes into the CNS was completely blunted in platelet-depleted mice. *denotes P < 0.05, ***denotes P < 0.0001.
Figure 3
Figure 3. HIV infection disrupts BBB integrity.
(a) Evans blue assay was performed to measure BBB permeability (N = 5 in each group) 10 w.p.i. Higher concentration of Evans blue dye was detected in the brains of HIV infected mice as evident by O.D. at 620 nm. (b) Higher levels of S100B, a CNS resident protein, were detected in peripheral blood plasma of HIV infected mice (10 w.p.i, N = 3 in each group). (c,d) Paraffin sections of brain (5 μm thick) obtained 10 w.p.i. were labeled with anti-Claudin5 (red) and counterstained with DAPI (blue) to label nuclei. Images were taken at 60X (objective magnification) and optically zoomed to 3. Scale bars are 10 μm. Relative Claudin 5 intensity was measured by dividing corrected integrated density with total area imaged from three random fields of view. These values were obtained using ImageJ software. Reduction in Claudin5 expression in vascular endothelial cells of infected mice was observed. (e,f) Immunoblot assay performed on brain lysates (N = 3 per group, 10 w.p.i.) show loss of another tight junction protein Occludin in HIV infected brains. Image J software was used to perform densitometry analysis.
Figure 4
Figure 4. HIV infection induces neuropathology in humanized mice.
Paraffin sections of brain (5 μm thick) obtained 10 w.p.i. were labeled with (a,b) anti-GFAP (red), astrocyte activation marker. Images from cortical region were taken at 40X. (c,d) anti-Iba1 (green), microglial activation marker. Images were taken at 60X. GFAP+ and Iba-1+ cells were enumerated using “particle analysis” tool from ImageJ software from three random fields of view. (e,f) Anti-MAP2 (red), anti-NeuN (green) neuronal markers. Images were taken at 60X and optically zoomed to 3 in (f). indicates dendritic beading and the section enclosed in a square indicates denritic thinning. All sections were counterstained with DAPI (blue) to label nuclei. Scale bars are 10 μm. (gi) Immunoblots showing the expression of Shh and Gli1 in the brain lysates collected from HIV infected and uninfected humanized mice (N = 3 per group). Image J software was used to perform densitometry analysis.
Figure 5
Figure 5. Smoothened agonist (SAG) rescues BBB integrity.
(a) 10 w.p.i. Evans blue assay was performed on HIV infected mice either administered with SAG or vehicle (N = 3–5 per group). (b) Detection of S100B protein levels in plasma by ELISA (N = 3 per group). *indicates P < 0.05 and ***denotes p < 0.0001. (cf) Paraffin sections of brain obtained 10 w.p.i. (5 μm thick) were labeled with anti-Claudin5 (red) or anti-Gli1 (red) and counterstained with DAPI (blue) to label nuclei. Images were taken at 60X for Claudin5 and 40X for Gli1 and optically zoomed to 3. Scale bars are 10 μm. Relative Claudin 5 and Gli-1 intensity was measured by dividing corrected integrated density with total area imaged from three random fields of view. These values were obtained using ImageJ software. Images show increased Claudin 5 and Gli1 expression in brain endothelial cells of SAG treated mice. (g) HBECs were treated with Tat (100 nM) with or without SAG (500 nM) for 24 h. RT-PCR profile of Gli1 expression indicates that Tat treatment caused a reduction in Gli1 expression and can be rescued by SAG treatment (representative gel picture from N = 3).
Figure 6
Figure 6
Inhibition of astrocyte activation by SAG (a,b). Paraffin sections of brain obtained 10 w.p.i (5 μm thick) were labeled with anti-GFAP (red), astrocyte activation marker and counterstained with DAPI. Images were taken at 40X. Scale bars are 10 μm. GFAP+ cells were enumerated using “particle analysis” tool from ImageJ software from three random fields of view. SAG treatment caused decrease in number of GFAP expressing cells. (c) Primary human astrocytes were treated with Tat (100 nM) in presence or absence of SAG (500 nM, N = 4) for 24 h. GFAP expression was measured by flow cytometry. *denotes p < 0.05 as compared to untreated cells and #indicates p < 0.05 as compared to Tat treated cells. (d) Plasma HIV p24 protein levels were detected by ELISA (10 w.p.i., N = 4 per group). (e) PBMCs from healthy donors were infected with HIV-GFP for 3 days and were treated with SAG or DMSO for 3 more days (N = 5). CD4+GFP+ cells were measured by flow cytometry.

Similar articles

Cited by

References

    1. Heaton R. K. et al. HIV-associated neurocognitive disorders before and during the era of combination antiretroviral therapy: differences in rates, nature, and predictors. J Neurovirol 17, 3–16, 10.1007/s13365-010-0006-1 (2011). - DOI - PMC - PubMed
    1. McArthur J. C. et al. Dementia in AIDS patients: incidence and risk factors. Multicenter AIDS Cohort Study. Neurology 43, 2245–2252 (1993). - PubMed
    1. Ghafouri M., Amini S., Khalili K. & Sawaya B. E. HIV-1 associated dementia: symptoms and causes. Retrovirology 3, 28, 10.1186/1742-4690-3-28 (2006). - DOI - PMC - PubMed
    1. Kaul M., Zheng J., Okamoto S., Gendelman H. E. & Lipton S. A. HIV-1 infection and AIDS: consequences for the central nervous system. Cell Death Differ 12 Suppl 1, 878–892, 10.1038/sj.cdd.4401623 (2005). - DOI - PubMed
    1. Atluri V. S. et al. Effect of human immunodeficiency virus on blood-brain barrier integrity and function: an update. Front Cell Neurosci 9, 212, 10.3389/fncel.2015.00212 (2015). - DOI - PMC - PubMed

Publication types

MeSH terms