. 2016 May 31:6:26886.
doi: 10.1038/srep26886.

Fire carbon emissions over maritime southeast Asia in 2015 largest since 1997

Affiliations

Fire carbon emissions over maritime southeast Asia in 2015 largest since 1997

V Huijnen et al. Sci Rep. .

Abstract

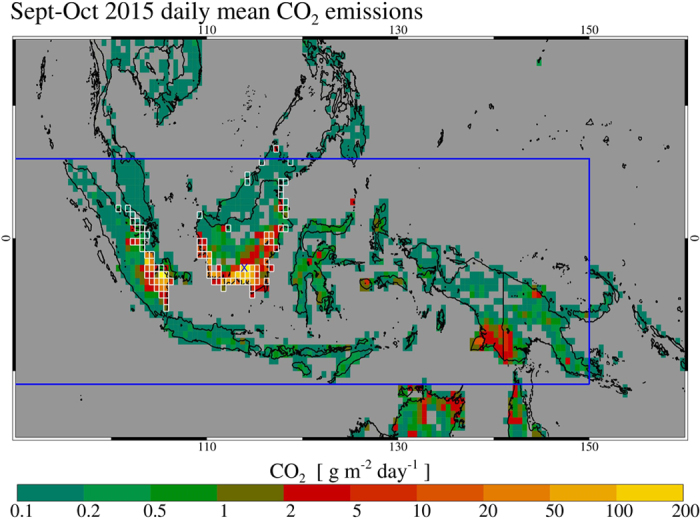
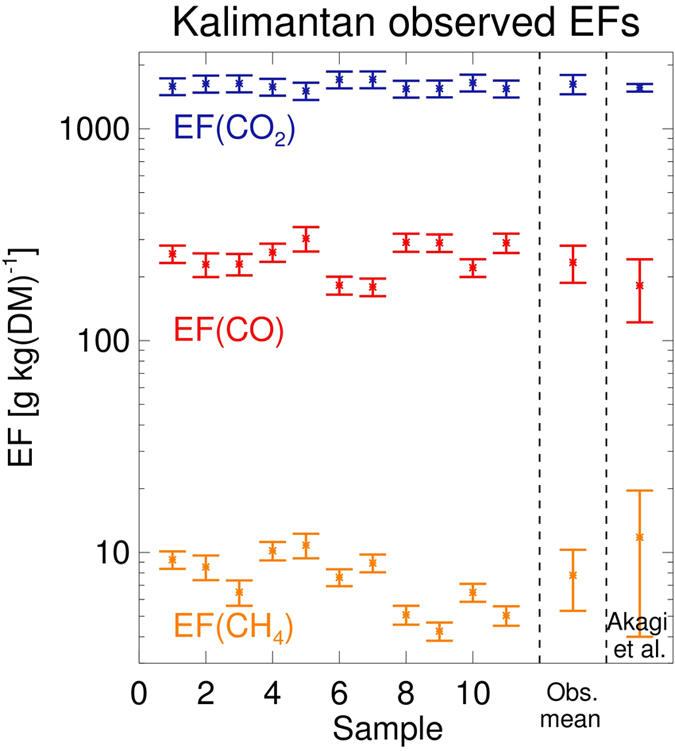
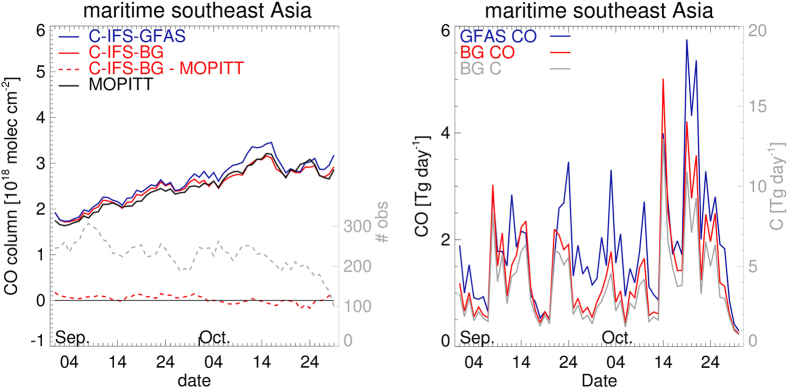
In September and October 2015 widespread forest and peatland fires burned over large parts of maritime southeast Asia, most notably Indonesia, releasing large amounts of terrestrially-stored carbon into the atmosphere, primarily in the form of CO2, CO and CH4. With a mean emission rate of 11.3 Tg CO2 per day during Sept-Oct 2015, emissions from these fires exceeded the fossil fuel CO2 release rate of the European Union (EU28) (8.9 Tg CO2 per day). Although seasonal fires are a frequent occurrence in the human modified landscapes found in Indonesia, the extent of the 2015 fires was greatly inflated by an extended drought period associated with a strong El Niño. We estimate carbon emissions from the 2015 fires to be the largest seen in maritime southeast Asia since those associated with the record breaking El Niño of 1997. Compared to that event, a much better constrained regional total carbon emission estimate can be made for the 2015 fires through the use of present-day satellite observations of the fire's radiative power output and atmospheric CO concentrations, processed using the modelling and assimilation framework of the Copernicus Atmosphere Monitoring Service (CAMS) and combined with unique in situ smoke measurements made on Kalimantan.


Figures

Figure 1
Figure 1. Daily mean CO2 emissions from peat and vegetation fires burning across maritime southeast Asia in Sept-Oct 2015, presented in 0.5° × 0.5° grid cells.
Cells containing peat soils according to landcover data used in GFAS are outlined in white (see Supplementary Information B). Locations of our in situ trace gas measurements lie close to the Central Kalimantan Capital of Palankaraya, Kalimantan (113.92°E, 2.21°S), indicated with the blue cross (See also Fig. 3). The thick blue line indicates the border of the study domain (east part only shown, full range 70°E–150°E; 11°S–6°N). Map was generated using IDL v8.4 software, http://www.exelisvis.com.
Figure 2
Figure 2. Emission factors (EFs) for CO, CO2 and CH4 calculated for individual tropical peat fires (g kg−1 DM) determined from in situ trace gas measurements made within smoke plumes on Kalimantan, Indonesia.
The mean and standard deviation per plume, along with the average over all plumes, are shown along with the EFs contained within the Akagi et al. database. All fires shown here burned on peat soils and were dominated by peat only fuel consumption, except that on 14 October (sample 7, location 3, see Fig. 3) when a smoke plume was sampled that came from an extremely large fire burning tropical forest atop peat soils.
Figure 3
Figure 3
Location of the field sites where smoke for the emissions factor calculations was sampled, approx. 30 km southeast of Palangkaraya, and shown via colour composite satellite imagery from the Landsat Enhanced Thematic Mapper Plus (ETM+) collected on 14 October 09:30 LT at 30 m spatial resolution. (A) Data from infrared bands only (RGB = 7,5,3) reveals a 20 km long flaming front progressing across a 16,000 ha peat-swamp forest block. (B) Imagery from the visible and infrared bands (RGB = 5,4,3) more clearly shows the thick smoke plume carried northwest by the prevailing easterly trade winds. Image striping is caused by the 2003 failure of the ETM+ Scan Line Corrector (SLC), but do not affect the interpretations made here. Inset in (B) shows coarser spatial resolution MODIS colour composite imagery of the same day, indicating the broader scale situation and the presence of large smoke plumes from the burning vegetation and peat. The southern coast of Kalimantan can be seen at the bottom of the inset. In situ measurement of these plumes was conducted at the four locations indicated by the flags in the inset, three of which are seen in the ETM+ subscene. On 12 October plumes 1–4 (Fig. 2) were measured at location 1. On 14 October (date of this imagery) plumes 5, 6 (location 2) and 7 (location 3) were measured. On 16 October plumes 8–11 (location 4) were measured. Map created using ArcMap v10.2.2 geospatial processing program http://www.esri.com. The LANDSAT imagery was downloaded from the US Geological Survey website at: http://earthexplorer.usgs.gov/.
Figure 4
Figure 4. Left panel: Evolution of the 3-day running mean CO column amounts calculated over the maritime southeast Asian region from C-IFS-GFAS (blue) and C-IFS-BG (red, solid), as compared to MOPITT observations (black).
Bias of C-IFS-BG CO column amounts with respect to MOPITT are also shown (red, dash). In grey dashes we shown the number of 1° × 1° gridded observational samples (right axis). Right panel: Evolution of GFAS (blue) and BG (red) CO emissions. In grey the corresponding total carbon emissions (right axis).

References

    1. Ropelewski C. F. & Halpert M. S. Global and Regional Scale Precipitation Patterns Associated with the El Niño/Southern Oscillation. Mon. Wea. Rev. 115, 1606–1626, doi: 10.1175/1520-0493(1987)115<1606:GARSPP>2.0.CO;2(1987 ). - DOI
    1. Field R. D. & Shen S. S. P. Predictability of carbon emissions from biomass burning in Indonesia from 1997 to 2006. J. Geophys. Res. 113, G04024, doi: 10.1029/2008JG000694 (2008). - DOI
    1. Ciais P. et al. Carbon and Other Biogeochemical Cycles in Climate Change 2013 The Physical Science Basis (eds Stocker T., Qin D. & Platner G.-K.) 465–570, doi: 10.1017/CBO9781107415324.015 (Cambridge University Press, 2013). - DOI
    1. Gaveau D. L. A. et al. Major atmospheric emissions from peat fires in Southeast Asia during non-drought years: evidence from the 2013 Sumatran fires. Sci. Rep. 4, 6112, doi: 10.1038/srep06112 (2014). - DOI - PMC - PubMed
    1. Wooster M. J., Perry G. L. W. & Zoumas A. Fire, drought and El Niño relationships on Borneo (Southeast Asia) in the pre-MODIS era (1980–2000). Biogeosciences 9, 317–340, doi: 10.5194/bg-9-317-2012 (2012). - DOI

Publication types

LinkOut - more resources