. 2016 Jun;147(6):451-65.
doi: 10.1085/jgp.201611581.

The exceptionally high reactivity of Cys 621 is critical for electrophilic activation of the sensory nerve ion channel TRPA1

Affiliations

The exceptionally high reactivity of Cys 621 is critical for electrophilic activation of the sensory nerve ion channel TRPA1

Parmvir K Bahia et al. J Gen Physiol. 2016 Jun.

Abstract

Activation of the sensory nerve ion channel TRPA1 by electrophiles is the key mechanism that initiates nociceptive signaling, and leads to defensive reflexes and avoidance behaviors, during oxidative stress in mammals. TRPA1 is rapidly activated by subtoxic levels of electrophiles, but it is unclear how TRPA1 outcompetes cellular antioxidants that protect cytosolic proteins from electrophiles. Here, using physiologically relevant exposures, we demonstrate that electrophiles react with cysteine residues on mammalian TRPA1 at rates that exceed the reactivity of typical cysteines by 6,000-fold and that also exceed the reactivity of antioxidant enzymes. We show that TRPA1 possesses a complex reactive cysteine profile in which C621 is necessary for electrophile-induced binding and activation. Modeling of deprotonation energies suggests that K620 contributes to C621 reactivity and mutation of K620 alone greatly reduces the effect of electrophiles on TRPA1. Nevertheless, binding of electrophiles to C621 is not sufficient for activation, which also depends on the function of another reactive cysteine (C665). Together, our results demonstrate that TRPA1 acts as an effective electrophilic sensor because of the exceptionally high reactivity of C621.


Figures

Figure 1.
Figure 1.
Electrophiles activate hTRPA1 faster than they react with conventional sulfhydryl groups in vitro. (A) 50 µM cinnamaldehyde activation of hTRPA1 in HEK293 (top, n = 28) and 50 µM cinnamaldehyde reaction with 5 mM GSH (bottom, n = 3). (B) 200 µM IA activation of hTRPA1 in HEK293 (top, n = 96) and its reaction with 5 mM GSH (bottom, n = 3). (A and B) Error bars denote SEM. (C) Absorbance of TNB at 412 nm. (D) Mean ± SEM loss of 100 µM TNB absorption at 412 nm after sequential reaction with 30 µM IA, 1 mM IA, and 100 mM NMM in control conditions (n = 3) and in the presence of 5 mM GSH (n = 3). (E) Mean ± SEM TNB loss after reaction with 30 µM IA, 1 mM NEM, and 100 mM NMM in control (n = 3) and with 5 mM GSH (n = 3). Error bars are too small to see on this scale.
Figure 2.
Figure 2.
Electrophiles activate hTRPA1 faster than they react with cytosolic sulfhydryl groups. (A and B) 300 µM H2O2 causes an oxidation-induced increase in roGFP 405/470 ratio in HEK293 (n = 327), prevented by pretreatment with 1 mM NEM (420 s, n = 106) but not by 30 µM IA (60 s, n = 189). Bars, 20 µm. (C) Mean ± SEM H2O2-induced change in 405/470 ratio is reduced by electrophilic stimuli >30 µM IA (60 s; n ≥ 84). *, P < 0.05. (D) IA activates hTRPA1 at [IA] ≥ 1 µM within 120 s. The dashed gray line denotes the response of nontransfected HEK293 to 100 µM IA (first and second stimuli); other colored lines denote hTRPA1-expressing HEK293 cells responding to varying [IA] (first stimulus) and 100 µM IA (second stimulus; n ≥ 36). Colored bars denote the specific duration of each treatment: 1–3 µM (540 s), 10 µM (180 s), and ≥30 µM (120 s). (E) Increasing IA exposure activates hTRPA1 faster, yielding consistent second order reaction rates. (F) Comparison of second order rates for electrophilic modification of GSH (n = 3 each) and TNB (n ≥ 3) and the activation of hTRPA1 (n > 28). (E and F) Error bars denote SEM.
Figure 3.
Figure 3.
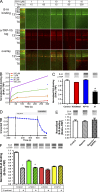
B-IA covalently binds reactive groups in hTRPA1. (A) Representative images of B-IA binding (green) on immunoprecipitated hTRPA1 quantified by the antibody against V5 tag (red). V5-tagged hTRPA1 had an expected mass of 131 kD. Overlay shows B-IA binding colocalizes with TRP channel. (B) Mean ± SEM for normalized B-IA binding on hTRPA1 (n ≥ 3). (C) Normalized 10 µM B-IA binding to hTRPA1 (60 s) is reduced by pretreatment with unlabeled IA (100 µM, 10 min) but not by TRPA1 inhibitors HC030031 (30 µM) and AP-18 (30 µM; n ≥ 3). The asterisk denotes difference from control (*, P < 0.05). (D) Mean ± SEM loss of 412-nm absorption after the reaction of 5 µM TNB with 100 µM IA (10 min) and 1 mM NEM (n = 3). (E) Normalized 10 µM B-IA binding to hTRPA1 (60 s) is unaffected by removal of intracellular polyphosphates (saponin) or by polyphosphate supplementation (saponin + NaPPPi; n = 3). (F) Normalized 10 µM B-IA (60 s) binding to hTRPA1, mTRPA1, rsTRPA1, and hTRPV1 (n ≥ 3). Asterisks denote difference from control (clear bars) with IA pretreatment (100 µM, 10 min; hatched bars; *, P < 0.05). (C, E, and F) Error bars denote SEM. All bands in the blots are 131 kD, except for the yellow bars in F, which are 90 kD.
Figure 4.
Figure 4.
hTRPA1 possesses four reactive Cys’s. (A, top) Treatment protocol for brief IA exposure of HEK293 cells expressing hTRPA1 for MS analysis. (bottom) Complete analysis of the percentage of each Cys adducted by IA, NEM, and NMM as determined by comparisons of identified MS/MS peaks. (B) Representative MS/MS spectra for tryptic peptide containing C621 (CAM modified) and C633 (NEM modified). (C) Representative MS/MS spectra for tryptic peptide containing C621 (CAM modified) and C633 (NMM modified). (B and C) Asterisks denote fragment ions with CAM modification. (D) Superimposed full scan mass spectra for the modified C621- and C633-containing tryptic peptide showing relative differences in peak intensity for each modified version (identified by different colors). Data are representative of the first analysis using a C18 column. Accurate mass-based (<5 ppm) reconstructed ion chromatograms were generated for each modified peptide, and the signal was averaged over the chromatographic peak width before superimposition. Overlay (3D) was performed in the Qual Browser (Thermo Fisher Scientific) data viewer followed by spectrum normalization to the largest peak in the scan with multiple scans normalized all the same. (E) Cartoon representation of hTRPA1 structure and approximate location of identified Cys’s (red indicates IA adduction). (F) Calculated rate reaction of IA for select hTRPA1 Cys’s, indicating the high reactivity of C621.
Figure 5.
Figure 5.
The role of C621 and C665 in rapid binding and activation of hTRPA1. (A) Normalized 10 µM B-IA (60 s) binding to hTRPA1 WT (white bars; n = 7) and C621A mutant (red bars; n = 4). (B) Normalized 10 µM B-IA (60 s) binding to hTRPA1 WT (white bars; n = 5) and C665L mutant (green bars; n = 6). (A and B) The dollar sign denotes difference from WT ($, P < 0.05). Asterisks denotes difference from control (clear bars) with IA pretreatment (100 µM, 10 min; hatched bars; *, P < 0.05). Bands in the blots are 131 kD. (C) Activation of TRPA1 constructs (WT, C621A, and C665L) by vehicle (Veh), 30 µM IA, and 200 µM thymol (n ≥ 49). (A–C) Error bars denote SEM.
Figure 6.
Figure 6.
K620 is required for high reactivity of C621. (A) Normalized 10 µM B-IA (60 s) binding to hTRPA1 at pH 7.4 (green bars) and 5.0 (red bars) without (clear bars) and with (hatched bars) IA pretreatment (100 µM, 10 min at pH 7.4; n ≥ 3). Dollar signs denote difference from pH 7.4 with pH 5.0 ($, P < 0.05). Asterisks denote difference from control with IA pretreatment (*, P < 0.05). IA pretreatment data were subtracted from control to show reactive binding (crosshatched bars). (B) Predicted structure of C621 domain based on Paulsen et al. (2015). (C) Modeling of the change in Cys deprotonation energies (ΔΔE) caused by proximity of CH4, NH4+, and HCOO groups. (D) Normalized 10 µM B-IA (60 s) binding to hTRPA1 WT (white bars, n = 6) and K620A mutant (blue bars, n = 8). The dollar sign denotes difference from WT ($, P < 0.05). Asterisks denote difference from control (clear bars) with IA pretreatment (100 µM, 10 min; hatched bars; *, P < 0.05). (A and D) All bands in the blots are 131 kD. (E) Activation of TRPA1 constructs (WT, C621A, and K620A) by vehicle (Veh), 30 µM IA, and 200 µM thymol (n ≥ 124). (F) Activation of TRPA1 constructs (WT, C621A, and K620A) by vehicle (Veh), 100 µM H2O2, 100 µM AITC, and 200 µM thymol (n ≥ 33). (A and D–F) Error bars denote SEM.

References

    1. Bandell M., Story G.M., Hwang S.W., Viswanath V., Eid S.R., Petrus M.J., Earley T.J., and Patapoutian A.. 2004. Noxious cold ion channel TRPA1 is activated by pungent compounds and bradykinin. Neuron. 41:849–857. 10.1016/S0896-6273(04)00150-3 - DOI - PubMed
    1. Bautista D.M., Jordt S.E., Nikai T., Tsuruda P.R., Read A.J., Poblete J., Yamoah E.N., Basbaum A.I., and Julius D.. 2006. TRPA1 mediates the inflammatory actions of environmental irritants and proalgesic agents. Cell. 124:1269–1282. 10.1016/j.cell.2006.02.023 - DOI - PubMed
    1. Becke A.D. 1993. Density-functional thermochemistry. III. The role of exact exchange. J. Chem. Phys. 98:5648–5652. 10.1063/1.464913 - DOI
    1. Bednar R.A. 1990. Reactivity and pH dependence of thiol conjugation to N-ethylmaleimide: detection of a conformational change in chalcone isomerase. Biochemistry. 29:3684–3690. 10.1021/bi00467a014 - DOI - PubMed
    1. Brigelius-Flohé R., and Flohé L.. 2011. Basic principles and emerging concepts in the redox control of transcription factors. Antioxid. Redox Signal. 15:2335–2381. 10.1089/ars.2010.3534 - DOI - PMC - PubMed

Publication types

MeSH terms

LinkOut - more resources