. 2016:572:1-49.
doi: 10.1016/bs.mie.2016.03.020. Epub 2016 Apr 27.

RNA Imaging with Multiplexed Error-Robust Fluorescence In Situ Hybridization (MERFISH)

Affiliations

RNA Imaging with Multiplexed Error-Robust Fluorescence In Situ Hybridization (MERFISH)

J R Moffitt et al. Methods Enzymol. 2016.

Abstract

Quantitative measurements of both the copy number and spatial distribution of large fractions of the transcriptome in single cells could revolutionize our understanding of a variety of cellular and tissue behaviors in both healthy and diseased states. Single-molecule fluorescence in situ hybridization (smFISH)-an approach where individual RNAs are labeled with fluorescent probes and imaged in their native cellular and tissue context-provides both the copy number and spatial context of RNAs but has been limited in the number of RNA species that can be measured simultaneously. Here, we describe multiplexed error-robust fluorescence in situ hybridization (MERFISH), a massively parallelized form of smFISH that can image and identify hundreds to thousands of different RNA species simultaneously with high accuracy in individual cells in their native spatial context. We provide detailed protocols on all aspects of MERFISH, including probe design, data collection, and data analysis to allow interested laboratories to perform MERFISH measurements themselves.

Keywords: In situ hybridization; RNA; Single cells; Single molecules; Single-molecule imaging; Transcriptomics.


Figures

Figure 1
Figure 1
Multiplexed, Error-Robust Fluorescence in situ Hybridization (MERFISH). (A) A schematic depiction of the process by which binary barcodes associated with each labeled RNA in a sample are readout. The presence or absence of fluorescence in each round of hybridization and imaging determines whether the barcode associated with each RNA in the sample has a `1' or `0' in the corresponding bit in the measured binary barcode. These barcodes are then used it identify each RNA, e.g. species, A, B, C, etc. (B) The number of RNA species that can be encoded with a binary barcode versus the number of bits N in those barcodes. A binary encoding scheme that utilizes all possible binary barcodes of length N is depicted in black. A binary encoding scheme that utilizes a subset of all possible binary barcodes that are all separated by at least a Hamming Distance of 4—an encoding scheme known as the Extended Hamming Code— is depicted in blue. A binary encoding scheme that utilizes a modified Hamming Distance 4 encoding scheme, which consists of all barcodes from the Extended Hamming Code that have a Hamming Weight of 4, i.e. only 4 `1' bits, is depicted in magenta. (C) The fraction of the binary barcodes that can be properly decoded into the correct RNA species—the calling rate— in the presence of modest readout errors as a function of the number of bits in the barcode for the same encoding schemes depicted in (B). (D) The fraction of binary barcodes that are misidentified as the wrong barcode and, thus, are decoded as the wrong RNA—the misidentification rate—as a function of the number of bits for the same encoding schemes depicted in (B). Panels (C) and (D) were calculated assuming an average `1'➔`0' error rate of 10% and a `0'➔`1' error rate of 4%, which correspond to the typical error rates observed in MERFISH measurements. Reproduced with permission from (Chen et al., 2015).
Figure 2
Figure 2
Schematic depiction of the hybridization process used for MERFISH. Cellular RNAs are hybridized with a set of oligonucleotide probes, which we term encoding probes. These encoding probes contain a targeting sequence which directs their binding to the specific RNA. They also contain two readout sequences. For an experiment utilizing N-bit binary barcodes, N different readout sequences will be used with each bit assigned a different unique readout sequence. The specific readout sequences contained by an encoding probe to a given RNA are determined by the binary barcode assigned to that RNA: only the readout sequences assigned to bits for which this barcode contains a `1' are used. Each encoding probe also contains PCR priming regions used in its construction. To increase the signal from each copy of the RNA, multiple encoding probes, each with a different target region, are bound to the same RNA. The length of this tile of probes is typically between 50–100 probes. To identify the readout sequences contained on the encoding probes bound to each RNA, N rounds of hybridization and imaging are performed. Each round uses a unique, fluorescently labeled probe whose sequence is complementary to the readout sequence for that round. The binding of these fluorescent probes determines the bits which contain a `1', allowing the measurement of the specified binary code. Modified with permission from (Chen et al., 2015).
Figure 3
Figure 3
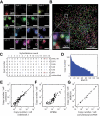
Example MERFISH data for a 16-bit MHD4 Code. (A) smFISH images from each of 16 rounds of hybridization of a small field of view of a Human fibroblast (IMR90) stained with encoding probes utilizing an 16-bit MHD4 code that encodes 140 RNAs. The label depicts the readout hybridization round corresponding to each image. Circles correspond to the locations of identified fluorescent spots. (B) A single 40-μm-square field of view with all measured barcodes marked. The color of each marker represents the measured barcode. (Inset) An overlay of the small section of this field of view depicted in (A) with each set of overlapping spots labeled. White circles correspond to sets of spots that represent a barcode that can be decoded into a RNA while red represents a set of spots for which the measured barcode does not represent an RNA. (C) The measured binary barcodes for each set of spots in the small field of view depicted in (A) with the identity of the RNA represented by that barcode. Error correction was required for two barcodes in hybridization round 14 and is represented by red crosses. (D) The number of RNAs of each species identified in the single field of view depicted in (D). ~2000 RNAs were measured in this single field of view, and in a single measurement ~100 such fields of view containing 250,000 RNAs can be measured. (E) The average RNA copy number per cell measured with one implementation of the 16-bit MHD4 code versus the average copy number per cell for every RNA measured with another 16-bit MHD4 code in which each RNA was assigned a different barcode. The dashed line represents equality. (F) The average RNA copy number per cell versus the abundance as measured with bulk RNA-seq (FPKM). (G) The average copy number per cell measured via MERFISH versus that measured using conventional smFISH for 15 different RNAs. The dashed line represents equality. Panels reproduced with permission from (Chen et al., 2015).
Figure 4
Figure 4
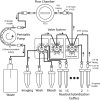
Schematic diagram of the setup of an automated flow system for a 16-round MERFISH measurement. Arrows mark the local flow direction. For clarity, only 4 of the 16 tubes and flow lines required for the different hybridization buffers are depicted. The sample is contained within the FCS2 flow chamber.
Figure 5
Figure 5
MERFISH quality metrics. (A) Left: The number of molecule counts whose code exactly match that of FLNA (blue) and the number of molecule counts whose code differ in one bit from the FLNA barcode (red). (Right) as in (left) except for a barcode that was left intentionally unused to serve as a misidentification control (Control). Lines connecting the central exact counts to counts to barcodes that contain a single-bit error denote `1'➔'0' errors. (B) The average rate at which a `1' ➔ `0' (top) or `0' ➔ `1' (bottom) error occurs at each bit. These error rates are derived from the ratios of the counts to the correct barcode (A, blue) relative to the counts to the barcodes that differ in a single-bit (A, red). (C) The confidence ratio for each used barcode (Real RNA, blue) from a 16-bit, MHD4 measurement normalized to the largest confidence ratio observed for the `blank' barcodes (Blank control, red). All data are reproduced with permission from (Chen et al., 2015).

References

    1. Babcock H, Sigal YM, Zhuang X. A high-density 3D localization algorithm for stochastic optical reconstruction microscopy. Opt. Nanoscopy. 2012;1:6. - PMC - PubMed
    1. Balagopal V, Parker R. Polysomes, P bodies and stress granules: states and fates of eukaryotic mRNAs. Curr. Opin. Cell Biol. 2009;21:403–408. - PMC - PubMed
    1. Batish M, Raj A, Tyagi S. RNA Detection and Visualization. In: Gerst JE, editor. Methods in Molecular Biology. Humana Press; Totowa, NJ: 2011.
    1. Beliveau BJ, Joyce EF, Apostolopoulos N, Yilmaz F, Fonseka CY, McCole RB, Chang Y, Li JB, Senaratne TN, Williams BR, et al. Versatile design and synthesis platform for visualizing genomes with Oligopaint FISH probes. Proc. Natl. Acad. Sci. 2012;109:21301–21306. - PMC - PubMed
    1. Besse F, Ephrussi A. Translational control of localized mRNAs: restricting protein synthesis in space and time. Nat. Rev. Mol. Cell Biol. 2008;9:971–980. - PubMed

Publication types