

In vivo confinement promotes collective migration of neural crest cells
- PMID: 27241911
- PMCID: PMC4896058
- DOI: 10.1083/jcb.201602083
In vivo confinement promotes collective migration of neural crest cells
Abstract
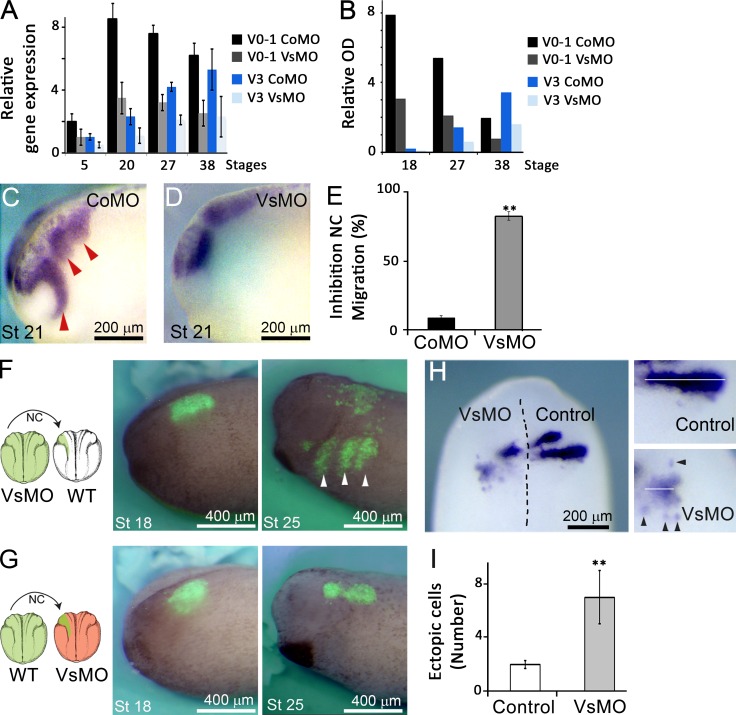
Collective cell migration is fundamental throughout development and in many diseases. Spatial confinement using micropatterns has been shown to promote collective cell migration in vitro, but its effect in vivo remains unclear. Combining computational and experimental approaches, we show that the in vivo collective migration of neural crest cells (NCCs) depends on such confinement. We demonstrate that confinement may be imposed by the spatiotemporal distribution of a nonpermissive substrate provided by versican, an extracellular matrix molecule previously proposed to have contrasting roles: barrier or promoter of NCC migration. We resolve the controversy by demonstrating that versican works as an inhibitor of NCC migration and also acts as a guiding cue by forming exclusionary boundaries. Our model predicts an optimal number of cells in a given confinement width to allow for directional migration. This optimum coincides with the width of neural crest migratory streams analyzed across different species, proposing an explanation for the highly conserved nature of NCC streams during development.
© 2016 Szabó et al.
Figures


Similar articles
-
Avian neural crest cell migration is diversely regulated by the two major hyaluronan-binding proteoglycans PG-M/versican and aggrecan.Development. 2000 Jul;127(13):2823-42. doi: 10.1242/dev.127.13.2823. Development. 2000. PMID: 10851128
-
Colec12 and Trail signaling confine cranial neural crest cell trajectories and promote collective cell migration.Dev Dyn. 2023 May;252(5):629-646. doi: 10.1002/dvdy.569. Epub 2023 Feb 6. Dev Dyn. 2023. PMID: 36692868
-
Guidance of neural crest cell migration: the inhibitory function of the chondroitin sulfate proteoglycan, versican.ScientificWorldJournal. 2006 Sep 6;6:1114-7. doi: 10.1100/tsw.2006.219. ScientificWorldJournal. 2006. PMID: 16964367 Free PMC article.
-
Cadherin-11 promotes neural crest cell spreading by reducing intracellular tension-Mapping adhesion and mechanics in neural crest explants by atomic force microscopy.Semin Cell Dev Biol. 2018 Jan;73:95-106. doi: 10.1016/j.semcdb.2017.08.058. Epub 2017 Sep 15. Semin Cell Dev Biol. 2018. PMID: 28919310 Review.
-
Modelling collective cell migration of neural crest.Curr Opin Cell Biol. 2016 Oct;42:22-28. doi: 10.1016/j.ceb.2016.03.023. Epub 2016 Apr 13. Curr Opin Cell Biol. 2016. PMID: 27085004 Free PMC article. Review.
Cited by
-
Variations in non-local interaction range lead to emergent chase-and-run in heterogeneous populations.J R Soc Interface. 2024 Oct;21(219):20240409. doi: 10.1098/rsif.2024.0409. Epub 2024 Oct 30. J R Soc Interface. 2024. PMID: 39474790
-
A biased random walk approach for modeling the collective chemotaxis of neural crest cells.J Math Biol. 2024 Feb 26;88(3):32. doi: 10.1007/s00285-024-02047-2. J Math Biol. 2024. PMID: 38407620 Free PMC article.
-
The Many Faces of Xenopus: Xenopus laevis as a Model System to Study Wolf-Hirschhorn Syndrome.Front Physiol. 2019 Jun 26;10:817. doi: 10.3389/fphys.2019.00817. eCollection 2019. Front Physiol. 2019. PMID: 31297068 Free PMC article.
-
Epithelial-to-mesenchymal transition and different migration strategies as viewed from the neural crest.Curr Opin Cell Biol. 2020 Oct;66:43-50. doi: 10.1016/j.ceb.2020.05.001. Epub 2020 Jun 9. Curr Opin Cell Biol. 2020. PMID: 32531659 Free PMC article. Review.
-
Provisional matrix: A role for versican and hyaluronan.Matrix Biol. 2017 Jul;60-61:38-56. doi: 10.1016/j.matbio.2016.12.001. Epub 2016 Dec 6. Matrix Biol. 2017. PMID: 27932299 Free PMC article. Review.
References
-
- Beck C.W., and Slack J.M.. 1999. A developmental pathway controlling outgrowth of the Xenopus tail bud. Development. 126:1611–1620. - PubMed
Publication types
MeSH terms
Substances
Grants and funding
LinkOut - more resources
Full Text Sources
Other Literature Sources
