. 2016 Jun 6;213(5):571-83.
doi: 10.1083/jcb.201510091. Epub 2016 May 30.

Postnatal telomere dysfunction induces cardiomyocyte cell-cycle arrest through p21 activation

Affiliations

Postnatal telomere dysfunction induces cardiomyocyte cell-cycle arrest through p21 activation

Esther Aix et al. J Cell Biol. .

Abstract

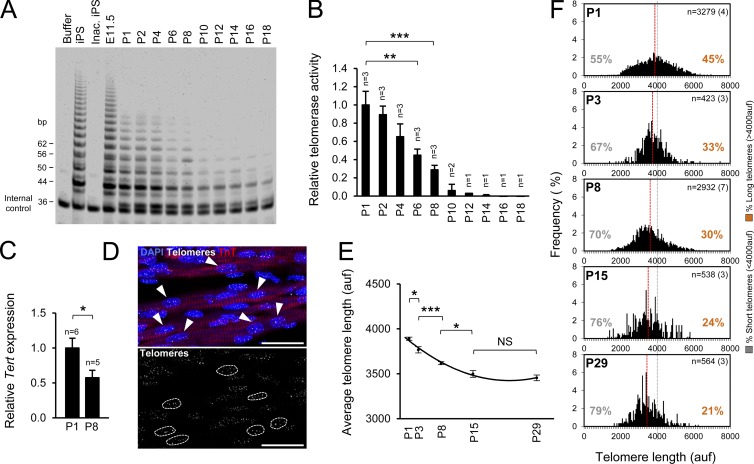
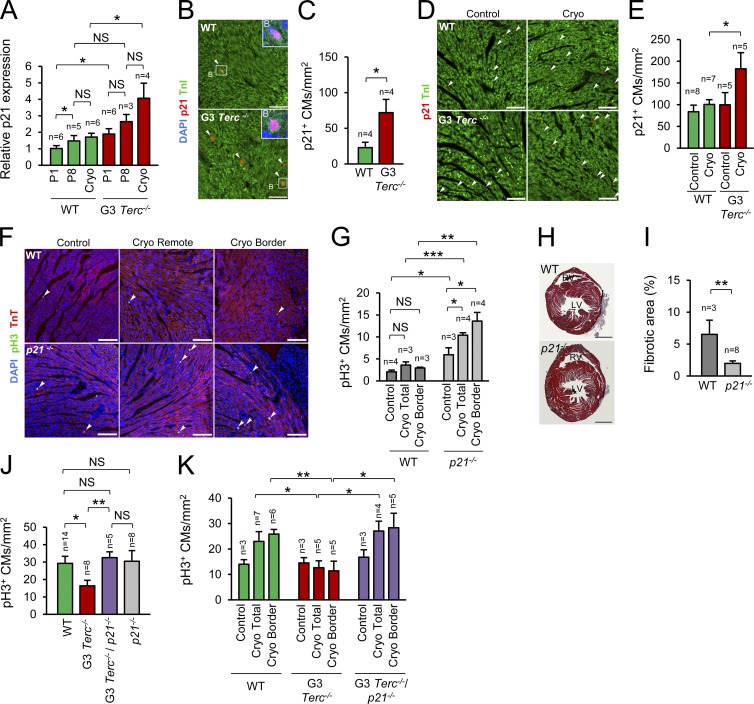
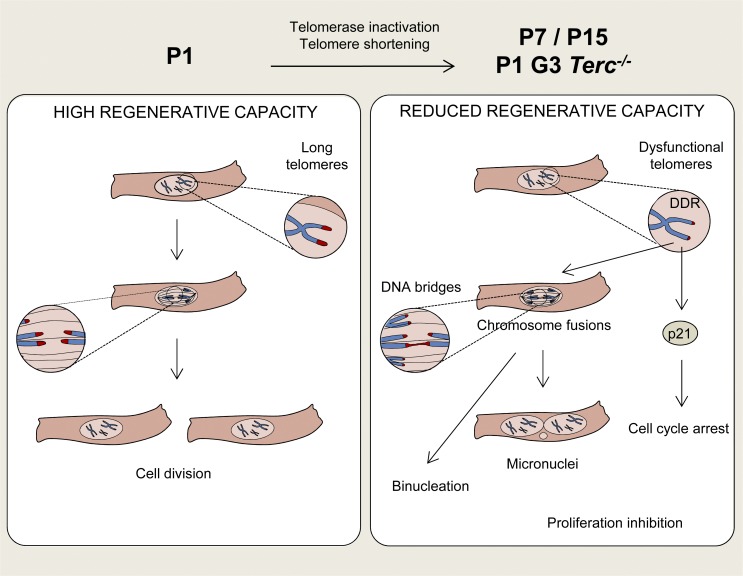
The molecular mechanisms that drive mammalian cardiomyocytes out of the cell cycle soon after birth remain largely unknown. Here, we identify telomere dysfunction as a critical physiological signal for cardiomyocyte cell-cycle arrest. We show that telomerase activity and cardiomyocyte telomere length decrease sharply in wild-type mouse hearts after birth, resulting in cardiomyocytes with dysfunctional telomeres and anaphase bridges and positive for the cell-cycle arrest protein p21. We further show that premature telomere dysfunction pushes cardiomyocytes out of the cell cycle. Cardiomyocytes from telomerase-deficient mice with dysfunctional telomeres (G3 Terc(-/-)) show precocious development of anaphase-bridge formation, p21 up-regulation, and binucleation. In line with these findings, the cardiomyocyte proliferative response after cardiac injury was lost in G3 Terc(-/-) newborns but rescued in G3 Terc(-/-)/p21(-/-) mice. These results reveal telomere dysfunction as a crucial signal for cardiomyocyte cell-cycle arrest after birth and suggest interventions to augment the regeneration capacity of mammalian hearts.


Figures

Figure 1.
Figure 1.
Rapid decrease in cardiac telomerase activity and CM telomere length after birth. (A) Telomerase activity in the postnatal heart measured by fluorescent TRAP. iPS cells and embryonic heart (embryonic day 11.5 [E11.5]) are positive controls; lysis buffer and inactivated iPS cells (Inac. iPS) are negative controls. In total, three litters were analyzed. The gel shows representative results from one litter. (B) Relative telomerase activity quantification. n indicates the number of animals analyzed. (C) Relative Tert gene expression levels in P1 and P8 hearts measured by quantitative PCR. n indicates the number of animals analyzed. (D) Detail of a confocal maximum projection image of telomere Q-FISH and TnT immunofluorescence. CM nuclei were manually selected using the TnT immunofluorescence image. Only unambiguously identified CMs were considered for the analysis. Arrowheads indicate CMs. Dashed lines indicate telomere signal in those CMs. Bars, 25 µm. (E) Mean CM telomere length during postnatal maturation. (F) CM telomere length distribution and percentage of relatively short (<4,000 auf) and long telomeres (>4,000 auf). Gray lines at 4,000 auf facilitate comparisons of telomere size distribution between conditions. Red lines indicate mean telomere length. n indicates the total number of CMs analyzed per group. The number of animals is shown in brackets. Data are mean ± SEM. *, P < 0.05; **, P < 0.01; ***, P < 0.001; NS, nonsignificant.
Figure 2.
Figure 2.
Proliferative CMs possess long telomeres. (A) Detail of a maximum-intensity projection confocal image of telomere Q-FISH and TnT/pH3 immunofluorescence. Proliferative (pH3+) and nonproliferative (pH3) CMs were manually selected using the pH3 and TnT immunofluorescence images. The white arrowhead indicates a pH3 CM; the yellow arrowhead indicates a pH3+ CM. Bar, 25 µm. (B) Mean telomere length in pH3+ and pH3 CMs. (C) Telomere-length distribution and percentage of relatively short (<4,000 auf) and long telomeres (>4,000 auf) in proliferative and nonproliferative CMs. Gray lines at 4,000 auf facilitate comparisons of telomere size distribution between conditions. Red lines indicate the mean telomere length. n indicates the number of CMs analyzed per group. The number of animals is shown in brackets. Data are mean ± SEM. *, P < 0.05; ***, P < 0.001; NS, nonsignificant.
Figure 3.
Figure 3.
Postnatal CMs with telomere shortening activate the DDR and form anaphase bridges. (A) Detail of telomere (Tel) Q-FISH and γH2AX/TnI immunofluorescence. Arrowheads indicate foci of the DNA-damage marker protein γH2AX at telomeres in a CM. Bars, 10 µm. (B) Quantification of the proportion of CMs with colocalized γH2AX and telomeres. n indicates the number of animals analyzed. (C) Confocal (left) and superresolution (right) images of DNA bridges in a dividing P8 CM. Arrowheads indicate a DNA bridge. Bars, 10 µm. (D) Proportion of anaphases-telophases with DNA bridges in CMs at P1 and P8. n indicates the number of animals analyzed per group. (E) P8 CM with a micronucleus. Bar, 25 µm. The arrowhead indicates the micronucleus. (F) Quantification of the proportion of CMs with a micronucleus at P1 and P8. n indicates the number of animals analyzed. Data are mean ± SEM. *, P < 0.05; **, P < 0.01.
Figure 4.
Figure 4.
CM proliferation is diminished in G3 Terc−/− P1 neonates. (A) Representative Masson’s trichrome staining on WT and G3 Terc−/− heart sections at P1. n indicates the number of animals analyzed. RV, right ventricle; LV, left ventricle. Bars, 500 µm. (B) WT and G3 Terc−/− heart weight at P1. n indicates the number of animals analyzed. (C) Heart weight (HW) to body weight (BW) ratio in WT and G3 Terc−/− P1 hearts. n indicates the number of animals analyzed. (D) WGA staining in WT and G3 Terc−/− P1 hearts. Bars, 25 µm. (E) CM size quantification in P1 heart transverse sections; 100 CMs were analyzed per animal. n indicates the number of animals analyzed. (F) Detail of pH3 and TnT immunofluorescence at P1. Arrowheads indicate CMs in mitosis. Bars, 100 µm. (G) Quantification of mitotic CMs at P1. n indicates the number of animals analyzed. (H) Detail of Aurora B kinase and TnT immunofluorescence. The arrowhead indicates the Aurora B signal in the cleavage furrow. Bar, 10 µm. (I) Quantification of CM cytokinesis at P1. n indicates the number of animals analyzed. (J) Quantification of P1 WT and G3 Terc−/− CMs stained with the DDR protein γH2AX at telomeres. n indicates the number of animals analyzed. (K) Representative image of DNA bridges in P1 G3 Terc−/− CMs. Arrowheads indicate DNA bridges in dividing CMs. Bars, 10 µm. (L) Percentage of anaphases-telophases with DNA bridges in P1 WT and G3 Terc−/− CMs. n indicates the number of animals analyzed per group. (M) Detail of mono- and binucleated CMs. Bars, 25 µm. (N) Percentage of mono- and binucleated CMs at P1. n indicates the number of animals analyzed. Data are mean ± SEM. *, P < 0.05; **, P < 0.01; ***, P < 0.001; NS, nonsignificant.
Figure 5.
Figure 5.
G3 Terc−/− P1 neonates do not increase CM proliferation in response to cardiac cryoinjury. (A) Representative Masson’s trichrome staining in WT and G3 Terc−/− hearts after cryoinjury at P1. Bars, 1 mm. (B) Quantification of the fibrotic area. n indicates the number of animals analyzed. (C) Detail of Masson’s trichrome staining at 28 dpi. Bars, 200 µm. (D) Quantification of the area covered by CMs within the remaining fibrotic tissue at 28 dpi. n indicates the number of animals analyzed. (E) pH3 and TnT immunofluorescence detail (7 dpi). Arrowheads indicate CMs in mitosis. Controls are age-matched uninjured animals. Cryo, cryoinjury. Bars, 100 µm. (F) Quantification of CM mitosis in WT and G3 Terc−/− mice. n indicates the number of animals analyzed. (G) Detail of Aurora B kinase and TnT immunofluorescence at 7 dpi. The arrowhead indicates the Aurora B signal in the cleavage furrow. Bar, 10 µm. (H) Quantification of CM cytokinesis (7 dpi). n indicates the number of animals analyzed. (I) Detail of WGA staining at 28 dpi. Bars, 50 µm. (J) Quantification of CM area in transverse sections at 28 dpi; 100 CMs from the injury vicinity were analyzed per animal. n indicates the number of animals analyzed. (K) Quantification of CMs stained with the γH2AX DNA damage protein at telomeres in control (P8) and cryoinjured (7 dpi at P1) animals. n indicates the number of animals analyzed. (L) Detail of telomere (Tel) Q-FISH and 53BP1/TnT immunofluorescence at 7 dpi. Arrowheads indicate colocalization of telomere and 53BP1 signals. Bars, 10 µm. (M) Quantification of CMs with 53BP1 at telomeres in control (P8) and cryoinjured (7 dpi at P1) animals. n indicates the number of animals analyzed. Data are mean ± SEM. *, P < 0.05; **, P < 0.01; ***, P < 0.001; NS, nonsignificant.
Figure 6.
Figure 6.
CM telomere dysfunction induces cell-cycle arrest through p21 activation. (A) Relative p21 gene expression measured by quantitative PCR. n indicates the number of animals analyzed. Cryo, cryoinjury at P1 analyzed at 7 dpi (at P8). (B) Detail of p21 and TnI immunofluorescence at P1. Arrowheads indicate p21-positive CMs. Bars, 50 µm. (C) Quantification of p21-positive CMs at P1. n indicates the number of animals analyzed. (D) Detail of p21 and TnI immunofluorescence analyzed 7 dpi at P1. Controls are age-matched uninjured animals. Arrowheads indicate p21-positive CMs. Bars, 50 µm. (E) Quantification of p21-positive CMs 7 dpi at P1. n indicates the number of animals analyzed. (F) Detail of pH3 and TnT immunofluorescence in WT and p21−/− mice analyzed 7 dpi at P7. Arrowheads indicate mitotic CMs. Bars, 100 µm. (G) Quantification of the number of CMs in mitosis in WT and p21−/− mice analyzed 7 dpi at P7. n indicates the number of animals analyzed. (H) Representative Masson’s trichrome staining in WT and p21−/− hearts cryoinjured at P7 and analyzed 28 dpi. Bars, 1 mm. (I) Quantification of fibrotic area in WT and p21−/− hearts cryoinjured at P7 and analyzed 28 dpi. n indicates the number of animals analyzed. (J) Number of CMs in mitosis in WT, G3 Terc−/−, G3 Terc−/−/p21−/−, and p21−/− mice at P1. n indicates the number of animals analyzed. (K) Number of CMs in mitosis in WT, G3 Terc−/−, and G3 Terc−/−/p21−/− mice cryoinjured at P1 and analyzed at 7 dpi. n indicates the number of animals analyzed. Data are mean ± SEM. *, P < 0.05; **, P < 0.01; ***, P < 0.001; NS, non-significant.
Figure 7.
Figure 7.
Proposed model. At P1, a proportion of CMs presents long telomeres, giving them potential to proliferate during postnatal development and in response to cardiac injury. However, during the first two postnatal weeks, most CMs inactivate telomerase and shorten their telomeres. Telomere shortening leads to the appearance of dysfunctional damaged telomeres, chromosome fusions, micronuclei, and binucleation and at the same time activates p21, ultimately leading to CM cell-cycle arrest. CMs with premature telomere shortening (P1 G3 Terc−/− CMs) precociously activate the DNA damage response at telomeres, form anaphase bridges, up-regulate p21, and binucleate, outcomes that reinforce the role of telomere shortening in the withdrawal of CMs from the cell cycle.

Similar articles

Cited by

References

    1. Artandi S.E., and Attardi L.D.. 2005. Pathways connecting telomeres and p53 in senescence, apoptosis, and cancer. Biochem. Biophys. Res. Commun. 331:881–890. 10.1016/j.bbrc.2005.03.211 - DOI - PubMed
    1. Baker D.J., Weaver R.L., and van Deursen J.M.. 2013. p21 both attenuates and drives senescence and aging in BubR1 progeroid mice. Cell Reports. 3:1164–1174. 10.1016/j.celrep.2013.03.028 - DOI - PMC - PubMed
    1. Bär C., Bernardes de Jesus B., Serrano R., Tejera A., Ayuso E., Jimenez V., Formentini I., Bobadilla M., Mizrahi J., de Martino A., et al. . 2014. Telomerase expression confers cardioprotection in the adult mouse heart after acute myocardial infarction. Nat. Commun. 5:5863 10.1038/ncomms6863 - DOI - PMC - PubMed
    1. Basel-Vanagaite L., Dokal I., Tamary H., Avigdor A., Garty B.Z., Volkov A., and Vulliamy T.. 2008. Expanding the clinical phenotype of autosomal dominant dyskeratosis congenita caused by TERT mutations. Haematologica. 93:943–944. 10.3324/haematol.12317 - DOI - PubMed
    1. Bednarek D., González-Rosa J.M., Guzmán-Martínez G., Gutiérrez-Gutiérrez Ó., Aguado T., Sánchez-Ferrer C., Marques I.J., Galardi-Castilla M., de Diego I., Gómez M.J., et al. . 2015. Telomerase is essential for Zebrafish heart regeneration. Cell Reports. 12:1691–1703. 10.1016/j.celrep.2015.07.064 - DOI - PMC - PubMed

Publication types

Substances

LinkOut - more resources