. 2016 May 13:10:219.
doi: 10.3389/fnhum.2016.00219. eCollection 2016.

Exploring Neuro-Physiological Correlates of Drivers' Mental Fatigue Caused by Sleep Deprivation Using Simultaneous EEG, ECG, and fNIRS Data

Affiliations

Exploring Neuro-Physiological Correlates of Drivers' Mental Fatigue Caused by Sleep Deprivation Using Simultaneous EEG, ECG, and fNIRS Data

Sangtae Ahn et al. Front Hum Neurosci. .

Abstract

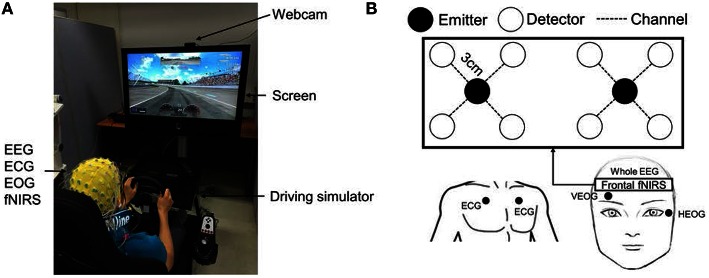
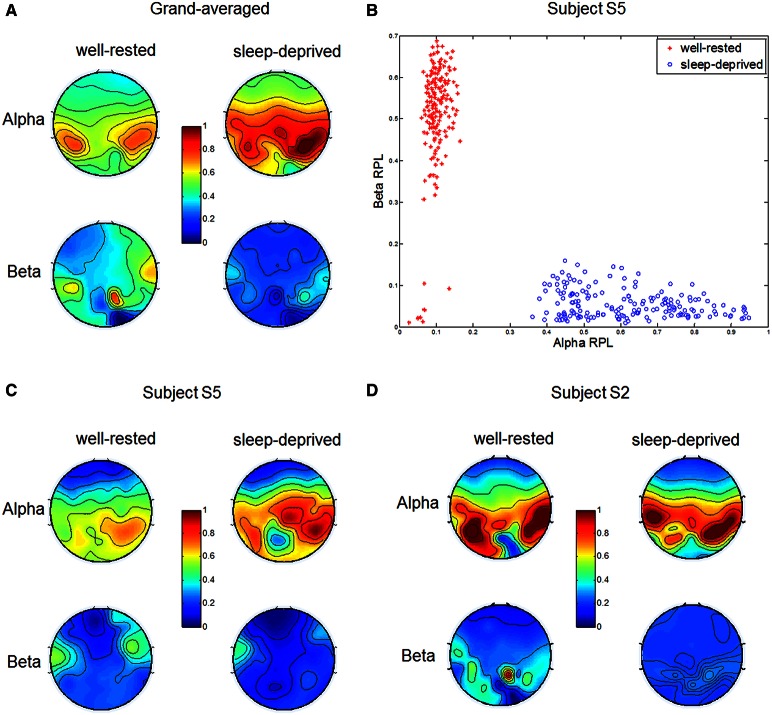
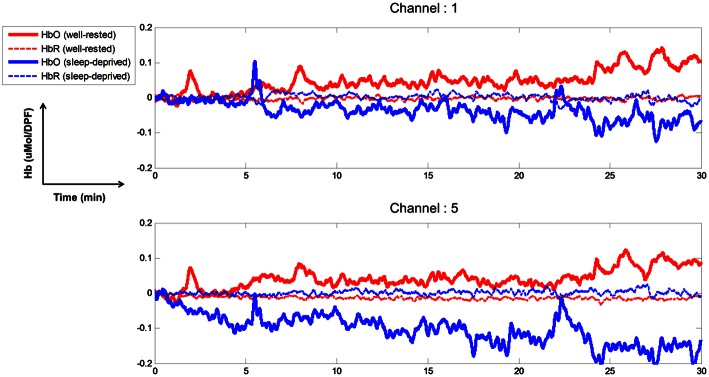
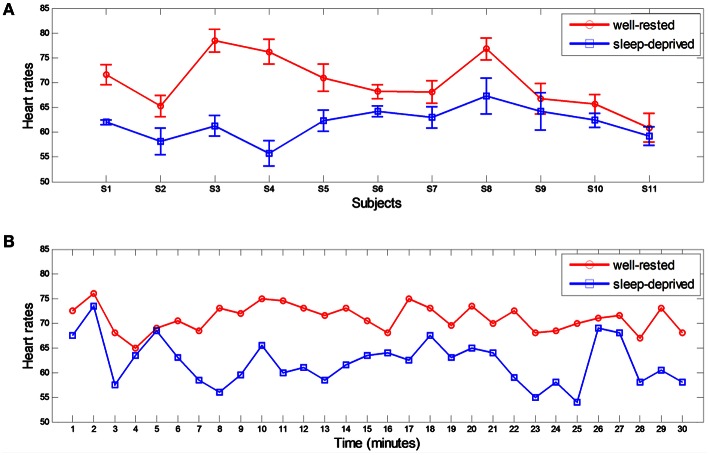
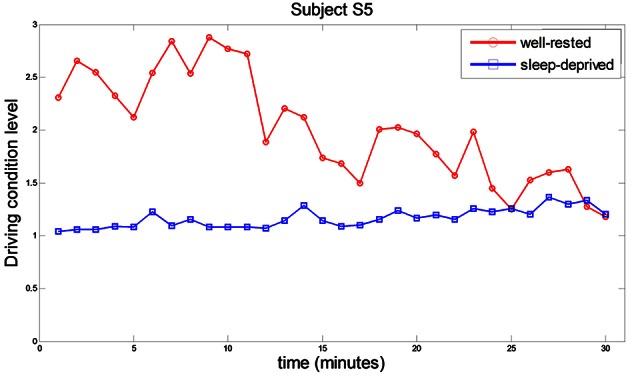
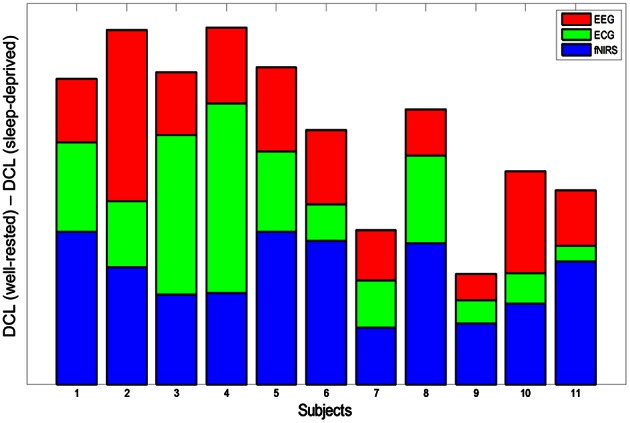
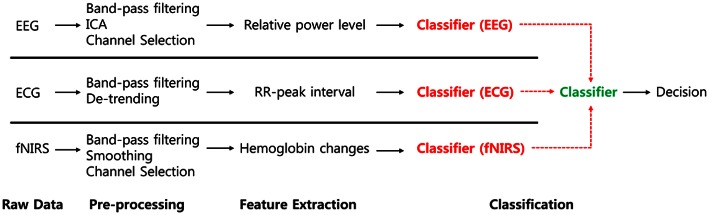
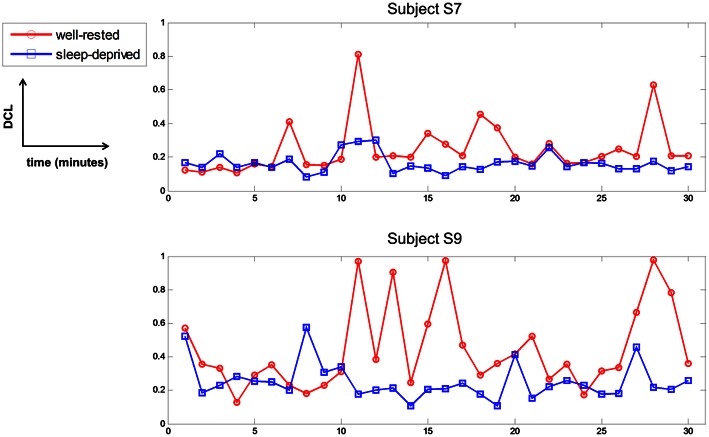
Investigations of the neuro-physiological correlates of mental loads, or states, have attracted significant attention recently, as it is particularly important to evaluate mental fatigue in drivers operating a motor vehicle. In this research, we collected multimodal EEG/ECG/EOG and fNIRS data simultaneously to develop algorithms to explore neuro-physiological correlates of drivers' mental states. Each subject performed simulated driving under two different conditions (well-rested and sleep-deprived) on different days. During the experiment, we used 68 electrodes for EEG/ECG/EOG and 8 channels for fNIRS recordings. We extracted the prominent features of each modality to distinguish between the well-rested and sleep-deprived conditions, and all multimodal features, except EOG, were combined to quantify mental fatigue during driving. Finally, a novel driving condition level (DCL) was proposed that distinguished clearly between the features of well-rested and sleep-deprived conditions. This proposed DCL measure may be applicable to real-time monitoring of the mental states of vehicle drivers. Further, the combination of methods based on each classifier yielded substantial improvements in the classification accuracy between these two conditions.

Keywords: EEG/ECG/EOG/fNIRS; drivers' mental fatigue; driving condition level; multimodal integration; neuro-physiological correlates; simulated driving; sleep deprivation.


Figures

Figure 1
Figure 1
Experimental setup for simulated driving. (A) Driving simulation environment with EEG/ECG/EOG/fNIRS measurements. (B) fNIRS setup in the prefrontal cortex. Two emitters and eight detectors (eight channels) were attached to the forehead. The distance between emitter and detector was 3 cm.
Figure 2
Figure 2
Relative power levels from EEG in two different conditions. (A) Grand-averaged alpha and beta RPLs in well-rested and sleep-deprived conditions. Alpha and beta RPLs differed significantly in the right centro-parietal and frontal regions, respectively. (B) Scatter plot of alpha (x-axis) and beta (y-axis) RPLs in two driving conditions (red asterisk: well-rested, blue circle: sleep-deprived) for subject S5. (C,D) Indicate alpha and beta RPLs in the well-rested and sleep-deprived conditions, in which subject S5 had the highest and S2 had the lowest classification accuracy, respectively.
Figure 3
Figure 3
Time course of relative concentration changes of HbO and HbR (channels 1 and 5). Solid, thick red and blue-colored lines indicate HbO for well-rested and sleep-deprived conditions, respectively. Dashed thin lines indicate HbR in the two conditions.
Figure 4
Figure 4
Heart rates from ECG in two different conditions. (A) Averaged heart rates for all subjects in well-rested and sleep-deprived conditions. (B) Subject 5's HRs over time. Each HR was estimated every minute.
Figure 5
Figure 5
Comparative driving condition level behavior in well-rested and sleep-deprived conditions while subject S5 was driving. Each point represents the averaged DCL value during one minute of driving. Red circles and blue squares represent the DCL in the well-rested and sleep-deprived conditions, respectively.
Figure 6
Figure 6
DCL difference (subtraction of sleep-deprived from well-rested) for all subjects. Each color represents modality-specific contribution to DCL difference (red: EEG, green: ECG, blue: fNIRS). Summation of the three colored bars indicates the synergistic effect of multimodal data on classification between the two driving conditions.
Figure 7
Figure 7
Flow diagram for classifier combination. Each classifier's output is regarded to second classifier's input.
Figure 8
Figure 8
Driving condition level of subject S7 and S9 in two conditions per 1 min over time. Red-circle and blue-square represent the driving condition level in well-rested and sleep-deprived conditions, respectively.

References

    1. Ahn M., Ahn S., Hong J. H., Cho H., Kim K., Kim B. S., et al. (2013a). Gamma band activity associated with BCI performance: simultaneous MEG/EEG study. Front. Hum. Neurosci. 7:848 10.3389/fnhum.2013.00848 - DOI - PMC - PubMed
    1. Ahn M., Cho H., Ahn S., Jun S. C. (2013b). High theta and low alpha powers may be indicative of BCI-Illiteracy in motor imagery. PLoS ONE 8:e80886 10.1371/journal.pone.0080886 - DOI - PMC - PubMed
    1. Ahn M., Jun S. C. (2015). Performance variation in motor imagery brain–computer interface: a brief review. J. Neurosci. Methods 243, 103–110. 10.1016/j.jneumeth.2015.01.033 - DOI - PubMed
    1. Ahn S., Ahn M., Cho H., Jun S. C. (2014). Achieving a hybrid brain-computer interface with tactile selective attention and motor imagery. J. Neural Eng. 11:066004. 10.1088/1741-2560/11/6/066004 - DOI - PubMed
    1. Alhola P., Polo-Kantola P. (2007). Sleep deprivation: impact on cognitive performance. Neuropsychiatr. Dis. Treat. 3, 553–567. - PMC - PubMed

LinkOut - more resources