

Age-Related Differences in the Modulation of Small-World Brain Networks during a Go/NoGo Task
- PMID: 27242512
- PMCID: PMC4869596
- DOI: 10.3389/fnagi.2016.00100
Age-Related Differences in the Modulation of Small-World Brain Networks during a Go/NoGo Task
Abstract
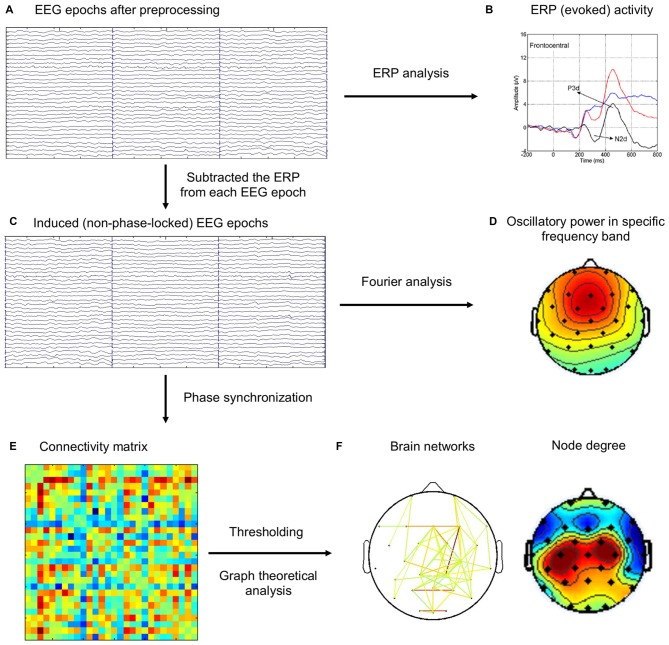
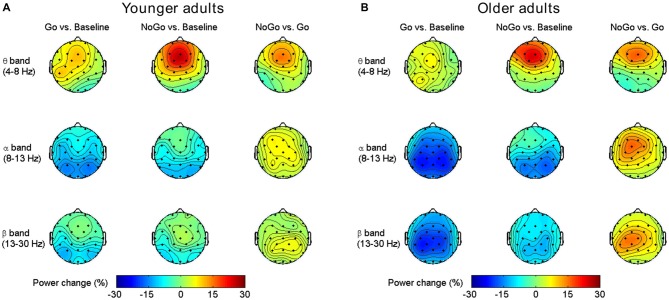
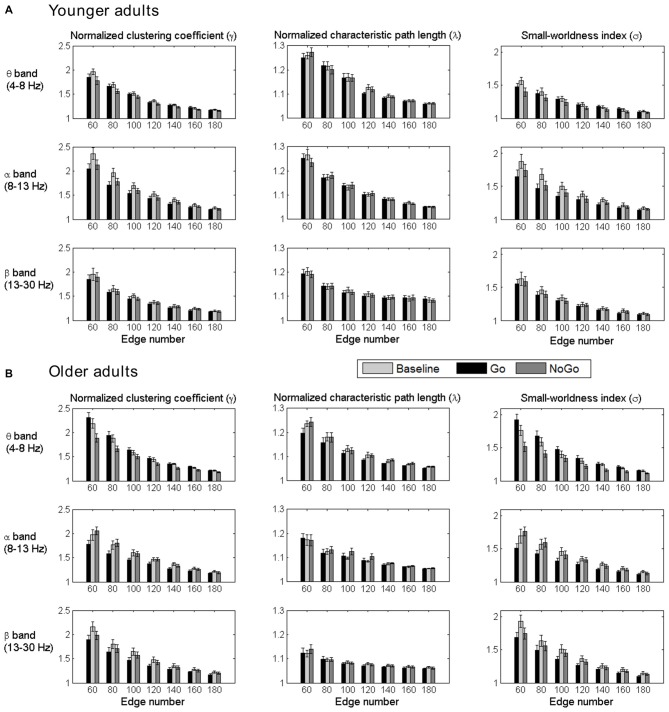
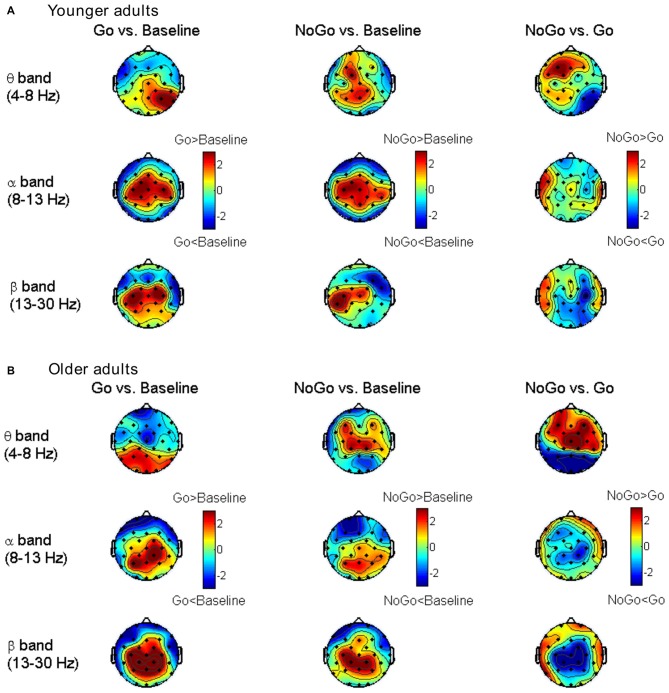
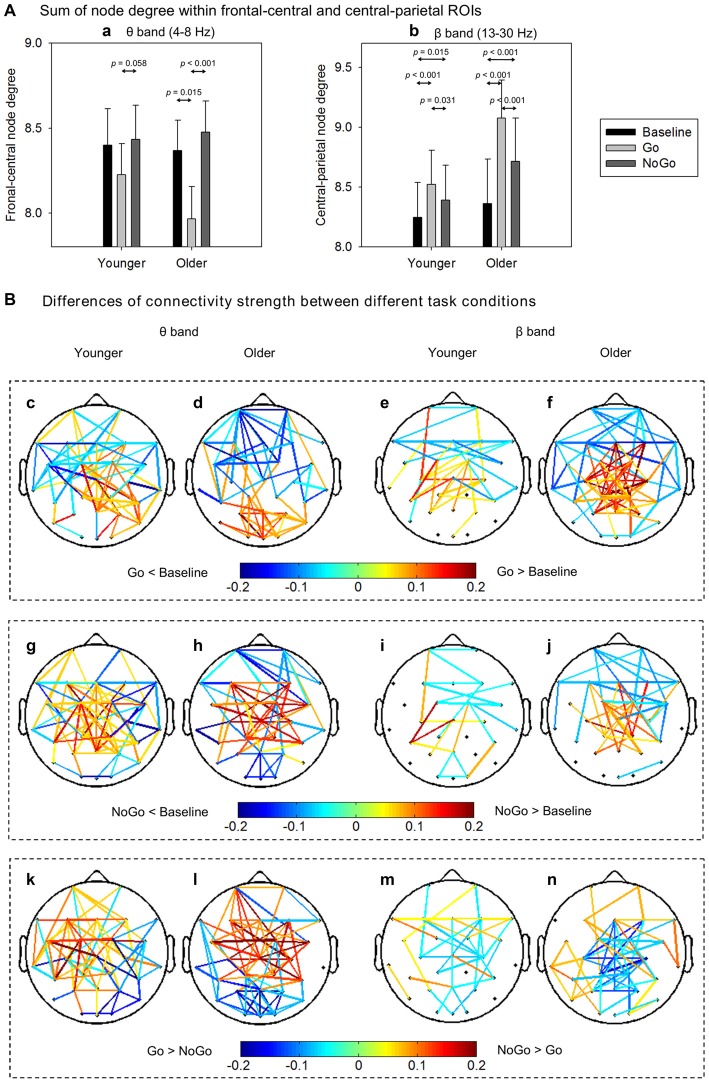
Although inter-regional phase synchrony of neural oscillations has been proposed as a plausible mechanism for response control, little is known about the possible effects due to normal aging. We recorded multi-channel electroencephalography (EEG) from healthy younger and older adults in a Go/NoGo task, and examined the aging effects on synchronous brain networks with graph theoretical analysis. We found that in both age groups, brain networks in theta, alpha or beta band for either response execution (Go) or response inhibition (NoGo) condition showed prominent small-world property. Furthermore, small-world property of brain networks showed significant differences between different task conditions. Further analyses of node degree suggested that frontal-central theta band phase synchrony was enhanced during response inhibition, whereas during response execution, increased phase synchrony was observed in beta band over central-parietal regions. More interestingly, these task-related modulations on brain networks were well preserved and even more robust in older adults compared with younger adults. Taken together, our findings not only suggest that response control involves synchronous brain networks in functionally-distinct frequency bands, but also indicate an increase in the recruitment of brain network resources due to normal aging.
Keywords: aging; graph theory; induced activity; phase synchrony; response inhibition.
Figures
Similar articles
-
Age-Related Alterations in Electroencephalography Connectivity and Network Topology During n-Back Working Memory Task.Front Hum Neurosci. 2018 Dec 6;12:484. doi: 10.3389/fnhum.2018.00484. eCollection 2018. Front Hum Neurosci. 2018. PMID: 30574079 Free PMC article.
-
Delta, theta, and alpha event-related oscillations in alcoholics during Go/NoGo task: Neurocognitive deficits in execution, inhibition, and attention processing.Prog Neuropsychopharmacol Biol Psychiatry. 2016 Feb 4;65:158-71. doi: 10.1016/j.pnpbp.2015.10.002. Epub 2015 Oct 9. Prog Neuropsychopharmacol Biol Psychiatry. 2016. PMID: 26456730 Free PMC article.
-
Aging alters functional connectivity of motor theta networks during sensorimotor reactions.Clin Neurophysiol. 2024 Feb;158:137-148. doi: 10.1016/j.clinph.2023.12.132. Epub 2024 Jan 3. Clin Neurophysiol. 2024. PMID: 38219403
-
Time-frequency-topographic analysis of induced power and synchrony of EEG signals during a Go/No-Go task.Int J Psychophysiol. 2009 Jan;71(1):9-16. doi: 10.1016/j.ijpsycho.2008.07.020. Epub 2008 Aug 7. Int J Psychophysiol. 2009. PMID: 18804495
-
Event-related neural oscillation changes following reasoning training in individuals with Mild Cognitive Impairment.Brain Res. 2019 Feb 1;1704:229-240. doi: 10.1016/j.brainres.2018.10.017. Epub 2018 Oct 17. Brain Res. 2019. PMID: 30342001
Cited by
-
Sensorineural Hearing Loss Affects Functional Connectivity of the Auditory Cortex, Parahippocampal Gyrus and Inferior Prefrontal Gyrus in Tinnitus Patients.Front Neurosci. 2022 Apr 1;16:816712. doi: 10.3389/fnins.2022.816712. eCollection 2022. Front Neurosci. 2022. PMID: 35431781 Free PMC article.
-
Dissociation of impulsive traits by subthalamic metabotropic glutamate receptor 4.Elife. 2022 Jan 4;11:e62123. doi: 10.7554/eLife.62123. Elife. 2022. PMID: 34982027 Free PMC article.
-
A new era for executive function research: On the transition from centralized to distributed executive functioning.Neurosci Biobehav Rev. 2021 May;124:235-244. doi: 10.1016/j.neubiorev.2021.02.011. Epub 2021 Feb 11. Neurosci Biobehav Rev. 2021. PMID: 33582233 Free PMC article. Review.
-
Behavioral inhibition corresponds to white matter fiber bundle integrity in older adults.Brain Imaging Behav. 2019 Dec;13(6):1602-1611. doi: 10.1007/s11682-019-00144-1. Brain Imaging Behav. 2019. PMID: 31209835 Free PMC article.
-
Sensorimotor mu rhythm during action observation changes across the lifespan independently from social cognitive processes.Dev Cogn Neurosci. 2019 Aug;38:100659. doi: 10.1016/j.dcn.2019.100659. Epub 2019 May 17. Dev Cogn Neurosci. 2019. PMID: 31132663 Free PMC article.
References
LinkOut - more resources
Full Text Sources
Other Literature Sources