. 2016 May 18:8:112.
doi: 10.3389/fnagi.2016.00112. eCollection 2016.

Abnormal Changes of Brain Cortical Anatomy and the Association with Plasma MicroRNA107 Level in Amnestic Mild Cognitive Impairment

Affiliations

Abnormal Changes of Brain Cortical Anatomy and the Association with Plasma MicroRNA107 Level in Amnestic Mild Cognitive Impairment

Tao Wang et al. Front Aging Neurosci. .

Abstract

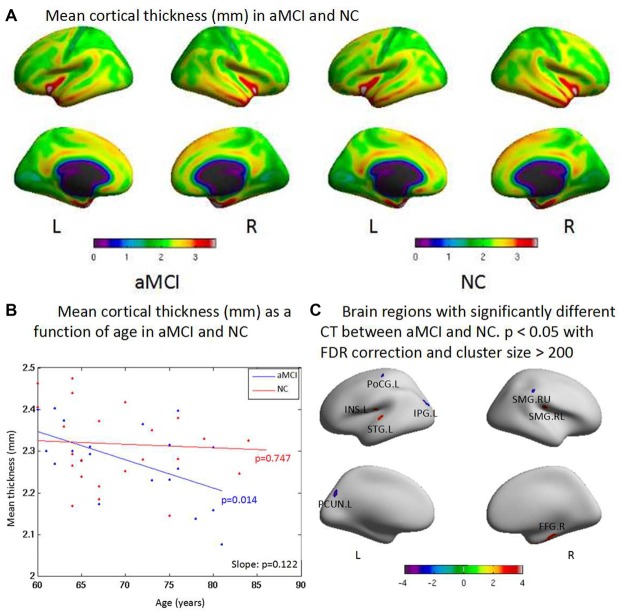
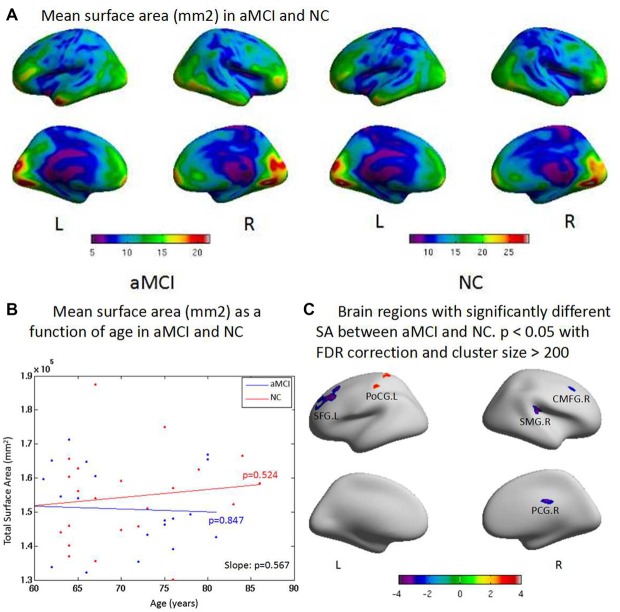
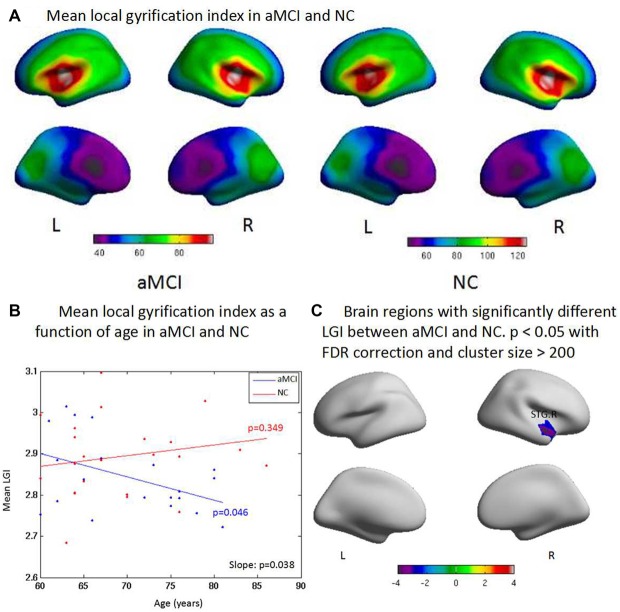
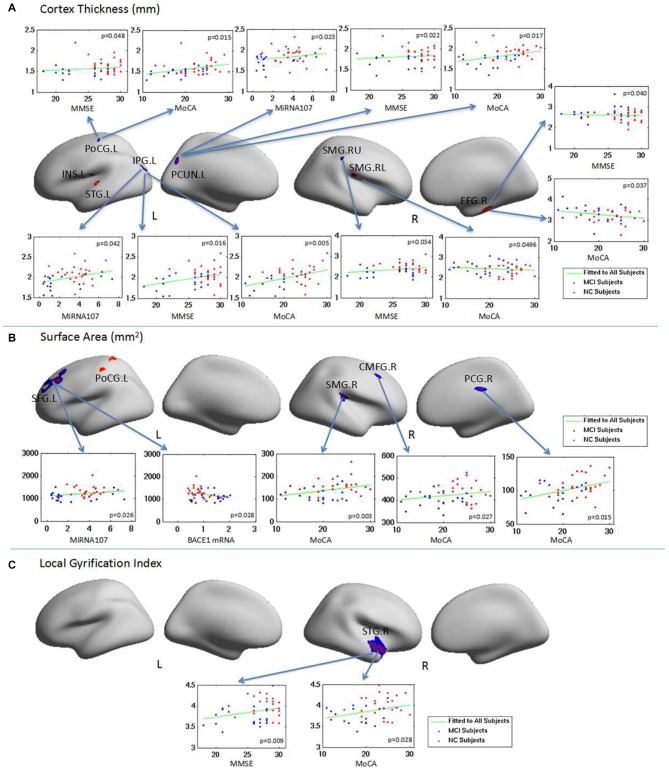
MicroRNA107 (Mir107) has been thought to relate to the brain structure phenotype of Alzheimer's disease. In this study, we evaluated the cortical anatomy in amnestic mild cognitive impairment (aMCI) and the relation between cortical anatomy and plasma levels of Mir107 and beta-site amyloid precursor protein (APP) cleaving enzyme 1 (BACE1). Twenty aMCI (20 aMCI) and 24 cognitively normal control (NC) subjects were recruited, and T1-weighted MR images were acquired. Cortical anatomical measurements, including cortical thickness (CT), surface area (SA), and local gyrification index (LGI), were assessed. Quantitative RT-PCR was used to examine plasma expression of Mir107, BACE1 mRNA. Thinner cortex was found in aMCI in areas associated with episodic memory and language, but with thicker cortex in other areas. SA decreased in aMCI in the areas associated with working memory and emotion. LGI showed a significant reduction in aMCI in the areas involved in language function. Changes in Mir107 and BACE1 messenger RNA plasma expression were correlated with changes in CT and SA. We found alterations in key left brain regions associated with memory, language, and emotion in aMCI that were significantly correlated with plasma expression of Mir107 and BACE1 mRNA. This combination study of brain anatomical alterations and gene information may shed lights on our understanding of the pathology of AD.

Clinical trial registration: http://www.ClinicalTrials.gov, identifier NCT01819545.

Keywords: Alzheimer’s disease; amnestic mild cognitive impairment; biological markers; genetics; surface-based morphometry.


Figures

Figure 1
Figure 1
(A) The cortex thicknesses are thinner in the superior parietal gyrus, postcentral gyrus, lingual gyrus and paracentral gyrus than other brain regions both in amnestic mild cognitive impairment (aMCI) and normal control (NC) in general. (B) aMCI shows less cortical thickness (CT) than NC when age increases but no significant difference is found between groups (p = 0.122). There is significant difference within group of aMCI when age increases (p = 0.014), while there is no significant difference within group of NC when age increases (p = 0.747). (C) The ROI-based analysis of CT revealed that the left postcentral gyrus (PoCG.L), the left inferior parietal gyrus (IPG.L), the left precuneus (PCUN.L) and the upside right supramarginal gyrus (SMG.RU) were significant group differences (p < 0.05) between the aMCI and the NC groups with the aMCI having thinner cortex than the NC. In addition, the left superior temporal gyrus (STG.L), the left insula (INS.L), the low side right supramarginal gyrus (SMG.RL) and the right fusiform gyrus (FFG.R) exhibited significantly (p < 0.05) larger thickness in the aMCI compared with the NC.
Figure 2
Figure 2
(A) There is no significant difference between two groups on the total surface area (SA). But aMCI shows less SA than NC when age increases. The surface areas are less in the superior parietal gyrus, postcentral gyrus, middle temporal gyrus and anterior cingulate gyrus than other brain regions both in aMCI and NC in general. (B) aMCI shows less SA than NC when age increases but no significant difference is found between groups (p = 0.567). There are no significant difference within group of aMCI (p = 0.847) and NC (p = 0.524) when age increases, respectively. (C) ROI based group analysis found significantly (p < 0.05) smaller SA in the left superior frontal gyrus (SFG.L), the right supramarginal gyrus (SMG.R), the right caudal middle frontal gyrus (CMFG.R) and the right posterior cingulate gyrus (PCG.R) in the aMCI, compared with the NC. In addition, the left postcentral gyrus (PoCG.L; p < 0.01) exhibited significantly larger SA in the aMCI compared with the NC.
Figure 3
Figure 3
(A) Compared with controls, aMCI has significant difference on the general local gyrification index (LGI) and one cluster where aMCI has significant LGI reduction. The LGI are higher in the superior temporal gyrus, and middle temporal gyrus than other brain regions both in aMCI and NC in general. (B) aMCI shows less CT than NC when age increases and significant difference is found between groups (p = 0.038). There is significant difference within group of aMCI when age increases (p = 0.046), while there is no significant difference within group of NC when age increases (p = 0.349). (C) The ROI based LGI group analysis shows a significant effect of the right superior temporal gyrus (STG.R; p < 0.05) in aMCI.
Figure 4
Figure 4
The relationship between brain regions with abnormal surface anatomy in aMCI and neuropsychological test scores and the plasma target gene expressions. Changes in CT, SA and LGI in aMCI were correlated with neuropsychological scores and/or plasma MiRNA 107 expression. (A) The relationship of CT with neuropsycological test score and the plasma expression of MiRNA 107. (B) The relationship of SA with neuropsycological test score and the plasma expression of MiRNA 107 and BACE1 mRNA. (C) The relationship of local gyrification and neuropsycological test score.

Similar articles

Cited by

References

    1. Albert M. S., DeKosky S. T., Dickson D., Dubois B., Feldman H. H., Fox N. C., et al. . (2011). The diagnosis of mild cognitive impairment due to Alzheimer’s disease: recommendations from the National Institute on Aging-Alzheimer’s Association workgroups on diagnostic guidelines for Alzheimer’s disease. Alzheimers Dement. 7, 270–279. 10.1016/j.jalz.2011.03.008 - DOI - PMC - PubMed
    1. Apostolova L. G., Steiner C. A., Akopyan G. G., Dutton R. A., Hayashi K. M., Toga A. W., et al. . (2007). Three-dimensional gray matter atrophy mapping in mild cognitive impairment and mild Alzheimer disease. Arch. Neurol. 64, 1489–1495. 10.1001/archneur.64.10.1489 - DOI - PMC - PubMed
    1. Bettens K., Brouwers N., Engelborghs S., Van Miegroet H., De Deyn P. P., Theuns J., et al. . (2009). APP and BACE1 miRNA genetic variability has no major role in risk for Alzheimer disease. Hum. Mutat. 30, 1207–1213. 10.1002/humu.21027 - DOI - PubMed
    1. Casanova M. F., El-Baz A., Vanbogaert E., Narahari P., Switala A. (2010). A topographic study of minicolumnar core width by lamina comparison between autistic subjects and controls: possible minicolumnar disruption due to an anatomical element in-common to multiple laminae. Brain Pathol. 20, 451–458. 10.1111/j.1750-3639.2009.00319.x - DOI - PMC - PubMed
    1. Davatzikos C. (2004). Why voxel-based morphometric analysis should be used with great caution when characterizing group differences. Neuroimage 23, 17–20. 10.1016/j.neuroimage.2004.05.010 - DOI - PubMed

Associated data