. 2016 May 17:8:113.
doi: 10.3389/fnagi.2016.00113. eCollection 2016.

Transcription Profile of Aging and Cognition-Related Genes in the Medial Prefrontal Cortex

Affiliations

Transcription Profile of Aging and Cognition-Related Genes in the Medial Prefrontal Cortex

Lara Ianov et al. Front Aging Neurosci. .

Abstract

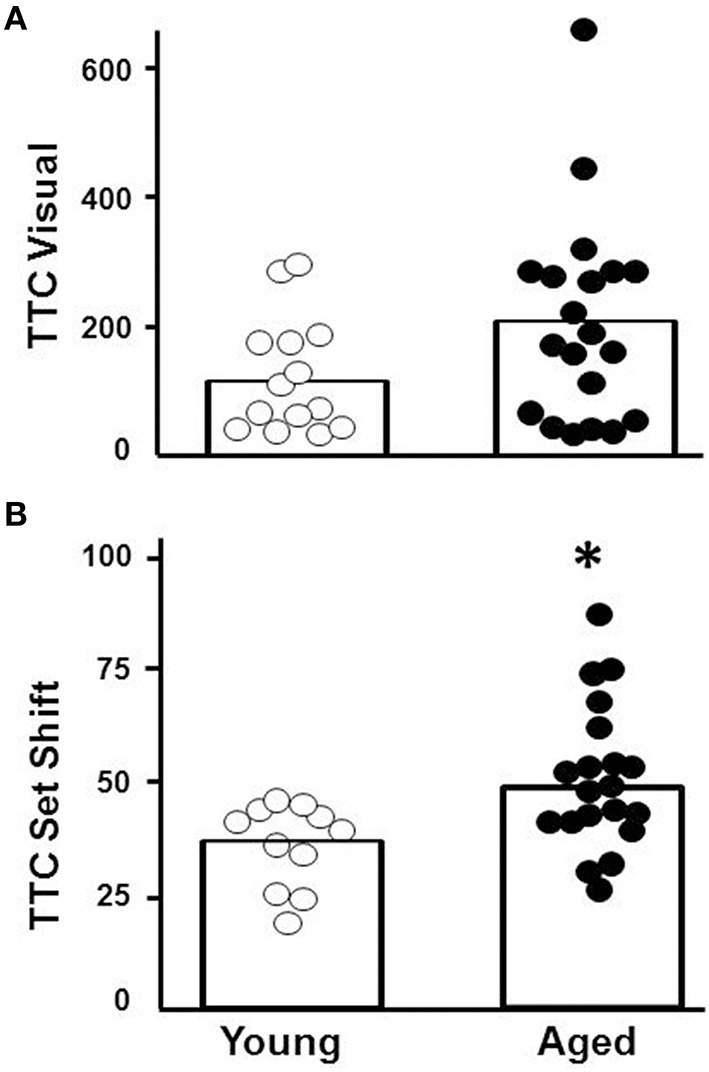
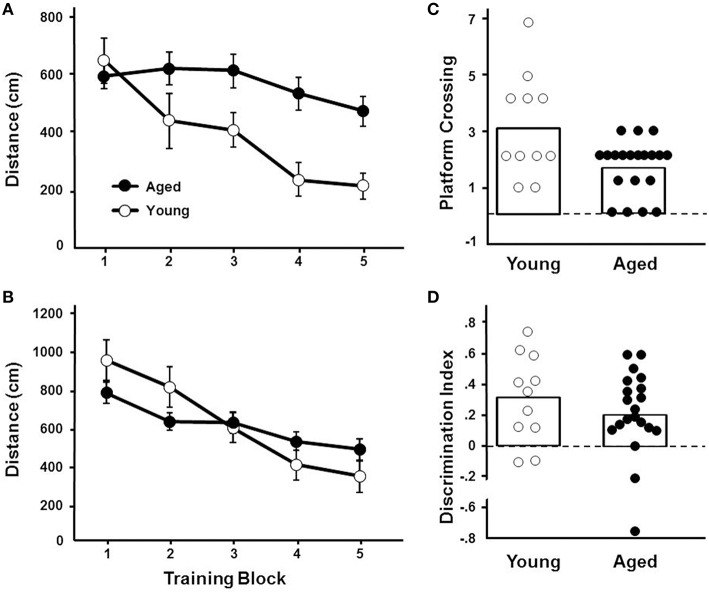
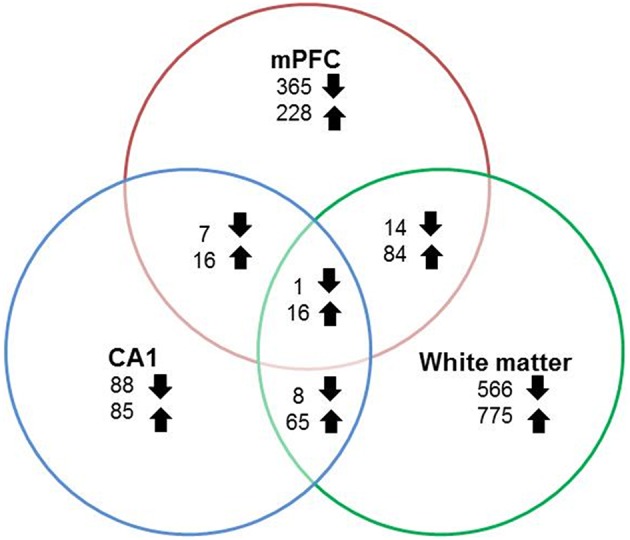
Cognitive function depends on transcription; however, there is little information linking altered gene expression to impaired prefrontal cortex function during aging. Young and aged F344 rats were characterized on attentional set shift and spatial memory tasks. Transcriptional differences associated with age and cognition were examined using RNA sequencing to construct transcriptomic profiles for the medial prefrontal cortex (mPFC), white matter, and region CA1 of the hippocampus. The results indicate regional differences in vulnerability to aging. Age-related gene expression in the mPFC was similar to, though less robust than, changes in the dorsolateral PFC of aging humans suggesting that aging processes may be similar. Importantly, the pattern of transcription associated with aging did not predict cognitive decline. Rather, increased mPFC expression of genes involved in regulation of transcription, including transcription factors that regulate the strength of excitatory and inhibitory inputs, and neural activity-related immediate-early genes was observed in aged animals that exhibit delayed set shift behavior. The specificity of impairment on a mPFC-dependent task, associated with a particular mPFC transcriptional profile indicates that impaired executive function involves altered transcriptional regulation and neural activity/plasticity processes that are distinct from that described for impaired hippocampal function.

Keywords: aging; cognitive flexibility; prefrontal cortex; set shifting task; transcription.


Figures

Figure 1
Figure 1
Region of the mPFC and white matter (WM) collected for RNA-seq. The right panel provides a schematic of a coronal slice +2.7 anterior to bregma diagram as adapted from Paxinos and Watson (1986) and illustrates the region of the mPFC and white matter collected for RNA-seq. The left panel shows a coronal slice from this same region.
Figure 2
Figure 2
Performance on the visual discrimination and set shift operant tasks. Trials to criteria (TTC) are illustrated for individual aged (filled circles, n = 20) and young (open circles, n = 11) animals during performance of the (A) initial visual discrimination and (B) set shift tasks. Asterisk indicates that aged animals exhibited more trails to criteria for the set shift task (p < 0.01). The open bars indicate the mean TTC for each group.
Figure 3
Figure 3
Performance on the water maze task. Symbols indicate the mean (±SEM) escape path length to the escape platform during five training blocks on the (A) cue and (B) spatial discrimination tasks for young (open symbols) and aged (filled symbols) animals. Individual (C) platform crossing and (D) discrimination index scores for young (open symbols) and aged (filled symbols) animals. The open bars indicate the means for each group.
Figure 4
Figure 4
Number of genes altered during aging across regions. Graphic summary of the total number of genes whose expression either significantly (p < 0.025) increased (up arrow) or decreased (down arrow) in the mPFC, region CA1, white matter, and across regions.
Figure 5
Figure 5
Heat map of age-related changes in gene expression for the mPFC. Each row represents a differentially expressed gene (p < 0.025) associated with aging. Expression for each gene was converted to a standardized score and the color represents the standard deviation increasing (red) or decreasing (blue) relative to the mean (gray). The age-related gene enrichment clusters are indicated (FDR p < 0.05). Top clusters: Genes that exhibit a decrease from young (left) to aged (right) animals. Bottom: Genes that exhibit an increase from young to aged animals.
Figure 6
Figure 6
Number of genes correlated with behavioral measures. Graphic summary for the number of mPFC genes whose expression either significantly increased (filled) or decreased (open) in relation to performance on the set shift and visual discrimination operant tasks, and a spatial memory task (Pearson's correlation p < 0.025). A large number of genes exhibited increased expression associated with impaired set shifting compared to visual discrimination and spatial discrimination index (DI).
Figure 7
Figure 7
Impaired set shifting is associated with increased expression of genes involved in transcription regulation. The z-scores for the cluster of 46 transcription regulation genes were averaged for each animal. Individual mean z-scores (y-axes) are plotted relative to z-scores for set shift TTC (x-axes). The correlation is illustrated as a regression line (dashed line).
Figure 8
Figure 8
Set shifting performance for animals used in RT-qPCR validations. The animals were selected based on set shifting performance to insure group differences in behavior. The bars illustrate this difference as the mean + SEM TTC for young (n = 9) and aged animals classified as unimpaired (AU, n = 6) and impaired (AI, n = 6) on the set shift task. Asterisks indicate a significant (p < 0.05) difference relative to AI animals.
Figure 9
Figure 9
Comparison between RT-qPCR and RNA-seq. Six genes were selected for validation experiments using a subset of animals. Each panel provides the mPFC expression determined by RT-qPCR (left, ΔΔCT values) and RNA-seq (right, counts). Two-tailed t-tests confirmed increased expression of Arc, Fos, Egr1, Egr2, and Egr4 in AI, relative to AU rats. Gene expression for young animals is provided for comparison to aged animals. For two genes, Lin7b and Egr4, age differences were confirmed (***p < 0.005, **p < 0.025, *p < 0.05).

Similar articles

Cited by

References

    1. Aenlle K. K., Foster T. C. (2010). Aging alters the expression of genes for neuroprotection and synaptic function following acute estradiol treatment. Hippocampus 20, 1047–1060. 10.1002/hipo.20703 - DOI - PMC - PubMed
    1. Aenlle K. K., Kumar A., Cui L., Jackson T. C., Foster T. C. (2009). Estrogen effects on cognition and hippocampal transcription in middle-aged mice. Neurobiol. Aging 30, 932–945. 10.1016/j.neurobiolaging.2007.09.004 - DOI - PMC - PubMed
    1. Andrews-Hanna J. R., Snyder A. Z., Vincent J. L., Lustig C., Head D., Raichle M. E., et al. . (2007). Disruption of large-scale brain systems in advanced aging. Neuron 56, 924–935. 10.1016/j.neuron.2007.10.038 - DOI - PMC - PubMed
    1. Barense M. D., Fox M. T., Baxter M. G. (2002). Aged rats are impaired on an attentional set-shifting task sensitive to medial frontal cortex damage in young rats. Learn. Mem. 9, 191–201. 10.1101/lm.48602 - DOI - PMC - PubMed
    1. Beas B. S., Setlow B., Bizon J. L. (2013). Distinct manifestations of executive dysfunction in aged rats. Neurobiol. Aging 34, 2164–2174. 10.1016/j.neurobiolaging.2013.03.019 - DOI - PMC - PubMed