Assessment of the Brain's Macro- and Micro-Circulatory Blood Flow Responses to CO2 via Transfer Function Analysis
- PMID: 27242536
- PMCID: PMC4860618
- DOI: 10.3389/fphys.2016.00162
Assessment of the Brain's Macro- and Micro-Circulatory Blood Flow Responses to CO2 via Transfer Function Analysis
Abstract
Objectives: At present, there is no standard bedside method for assessing cerebral autoregulation (CA) with high temporal resolution. We combined the two methods most commonly used for this purpose, transcranial Doppler sonography (TCD, macro-circulation level), and near-infrared spectroscopy (NIRS, micro-circulation level), in an attempt to identify the most promising approach.
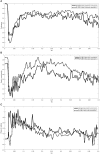
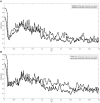
Methods: In eight healthy subjects (5 women; mean age, 38 ± 10 years), CA disturbance was achieved by adding carbon dioxide (CO2) to the breathing air. We simultaneously recorded end-tidal CO2 (ETCO2), blood pressure (BP; non-invasively at the fingertip), and cerebral blood flow velocity (CBFV) in both middle cerebral arteries using TCD and determined oxygenated and deoxygenated hemoglobin levels using NIRS. For the analysis, we used transfer function calculations in the low-frequency band (0.07-0.15 Hz) to compare BP-CBFV, BP-oxygenated hemoglobin (OxHb), BP-tissue oxygenation index (TOI), CBFV-OxHb, and CBFV-TOI.
Results: ETCO2 increased from 37 ± 2 to 44 ± 3 mmHg. The CO2-induced CBFV increase significantly correlated with the OxHb increase (R (2) = 0.526, p < 0.001). Compared with baseline, the mean CO2 administration phase shift (in radians) significantly increased (p < 0.005) from -0.67 ± 0.20 to -0.51 ± 0.25 in the BP-CBFV system, and decreased from 1.21 ± 0.81 to -0.05 ± 0.91 in the CBFV-OxHb system, and from 0.94 ± 1.22 to -0.24 ± 1.0 in the CBFV-TOI system; no change was observed for BP-OxHb (0.38 ± 1.17 to 0.41 ± 1.42). Gain changed significantly only in the BP-CBFV system. The correlation between the ETCO2 change and phase change was higher in the CBFV-OxHb system [r = -0.60; 95% confidence interval (CI): -0.16, -0.84; p < 0.01] than in the BP-CBFV system (r = 0.52; 95% CI: 0.03, 0.08; p < 0.05).
Conclusion: The transfer function characterizes the blood flow transition from macro- to micro-circulation by time delay only. The CBFV-OxHb system response with a broader phase shift distribution offers the prospect of a more detailed grading of CA responses. Whether this is of clinical relevance needs further studies in different patient populations.
Keywords: cerebral autoregulation; cerebral blood flow; near-infrared spectroscopy; transcranial Doppler ultrasound; transfer function.
Figures


References
-
- Claassen J. A., Meel-van den Abeelen A. S., Simpson D. M., Panerai R. B., on behalf of the international Cerebral Autoregulation Research Network (CARNet). (2016). Transfer function analysis of dynamic cerebral autoregulation: a white paper from the International Cerebral Autoregulation Research Network. J. Cereb. Blood Flow Metab. 36, 665–680. 10.1177/0271678X15626425 - DOI - PMC - PubMed
-
- Cooper J. A., Tichauer K. M., Boulton M., Elliott J., Diop M., Arango M., et al. . (2011). Continuous monitoring of absolute cerebral blood flow by near-infrared spectroscopy during global and focal temporary vessel occlusion. J. Appl. Physiol. 110, 1691–1698. 10.1152/japplphysiol.01458.2010 - DOI - PubMed
-
- Harper S. L., Bohlen H. G., Rubin M. J. (1984). Arterial and microvascular contributions to cerebral cortical au-toregulation. Am. J. Physiol. 246, H17–H24. - PubMed
LinkOut - more resources
Full Text Sources
Other Literature Sources

