

Mitochondrial Ultrastructure and Glucose Signaling Pathways Attributed to the Kv1.3 Ion Channel
- PMID: 27242550
- PMCID: PMC4871887
- DOI: 10.3389/fphys.2016.00178
Mitochondrial Ultrastructure and Glucose Signaling Pathways Attributed to the Kv1.3 Ion Channel
Abstract
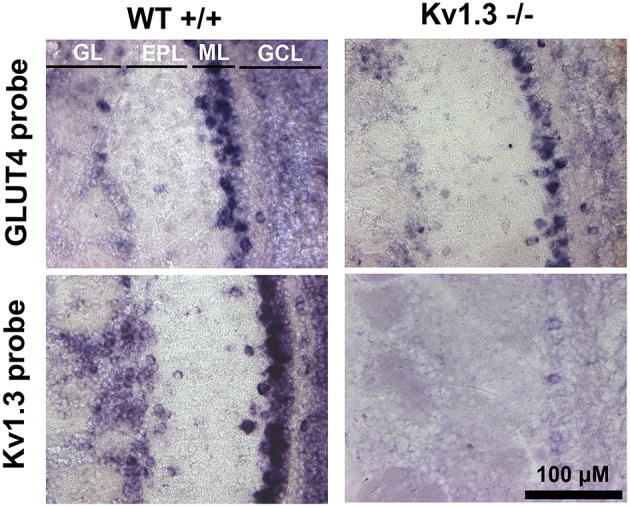
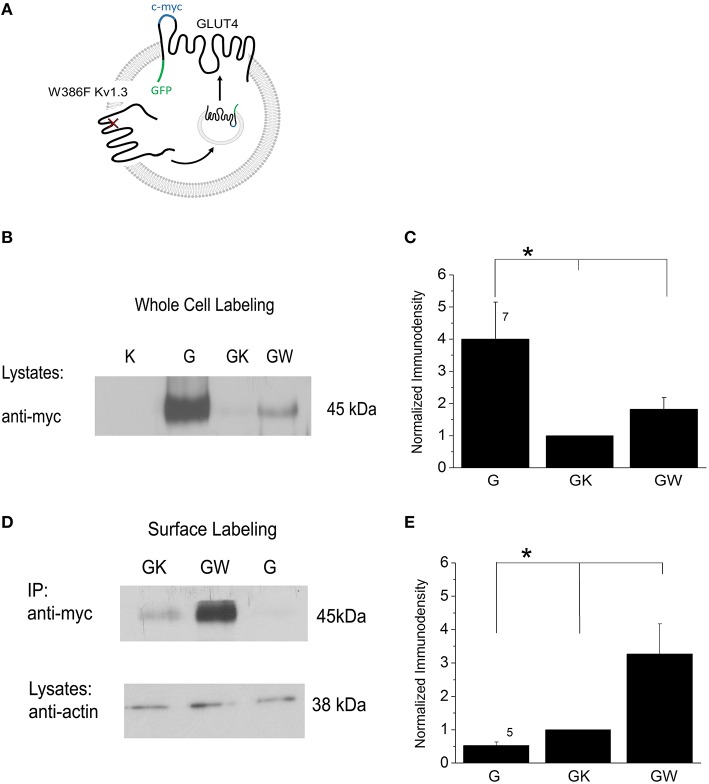
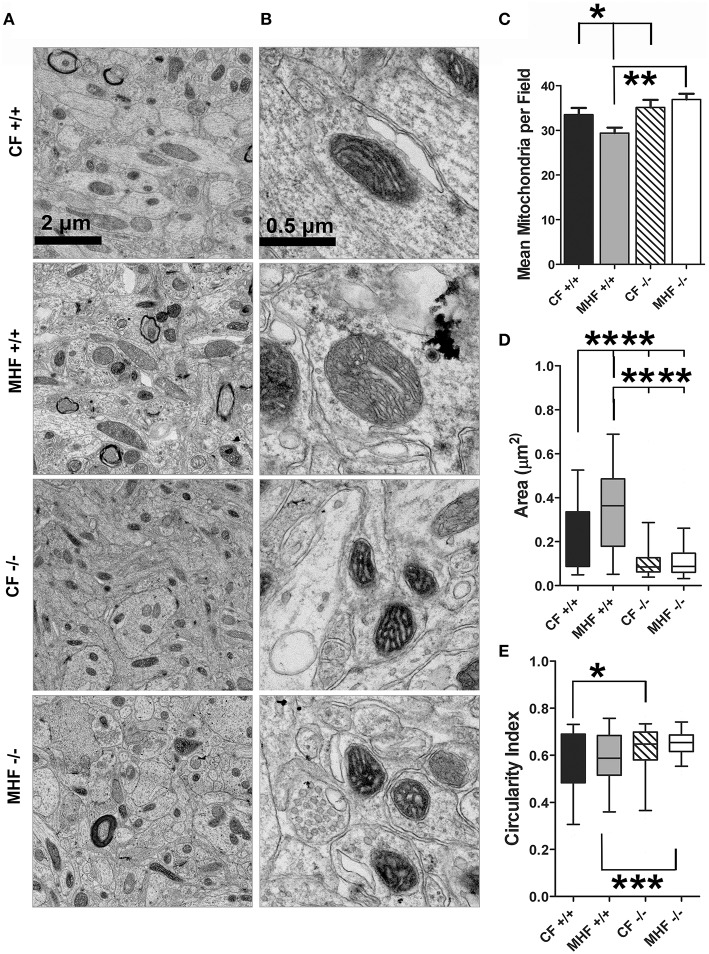
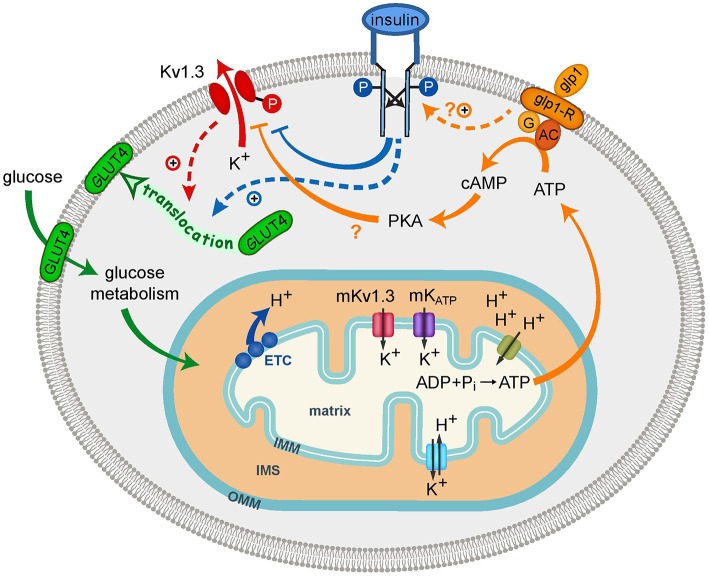
Gene-targeted deletion of the potassium channel Kv1.3 (Kv1.3(-∕-)) results in "Super-smeller" mice with a sensory phenotype that includes an increased olfactory ability linked to changes in olfactory circuitry, increased abundance of olfactory cilia, and increased expression of odorant receptors and the G-protein, Golf. Kv1.3(-∕-) mice also have a metabolic phenotype including lower body weight and decreased adiposity, increased total energy expenditure (TEE), increased locomotor activity, and resistance to both diet- and genetic-induced obesity. We explored two cellular aspects to elucidate the mechanism by which loss of Kv1.3 channel in the olfactory bulb (OB) may enhance glucose utilization and metabolic rate. First, using in situ hybridization we find that Kv1.3 and the insulin-dependent glucose transporter type 4 (GLUT4) are co-localized to the mitral cell layer of the OB. Disruption of Kv1.3 conduction via construction of a pore mutation (W386F Kv1.3) was sufficient to independently translocate GLUT4 to the plasma membrane in HEK 293 cells. Because olfactory sensory perception and the maintenance of action potential (AP) firing frequency by mitral cells of the OB is highly energy demanding and Kv1.3 is also expressed in mitochondria, we next explored the structure of this organelle in mitral cells. We challenged wildtype (WT) and Kv1.3(-∕-) male mice with a moderately high-fat diet (MHF, 31.8 % kcal fat) for 4 months and then examined OB ultrastructure using transmission electron microscopy. In WT mice, mitochondria were significantly enlarged following diet-induced obesity (DIO) and there were fewer mitochondria, likely due to mitophagy. Interestingly, mitochondria were significantly smaller in Kv1.3(-∕-) mice compared with that of WT mice. Similar to their metabolic resistance to DIO, the Kv1.3(-∕-) mice had unchanged mitochondria in terms of cross sectional area and abundance following a challenge with modified diet. We are very interested to understand how targeted disruption of the Kv1.3 channel in the OB can modify TEE. Our study demonstrates that Kv1.3 regulates mitochondrial structure and alters glucose utilization; two important metabolic changes that could drive whole system changes in metabolism initiated at the OB.
Keywords: diet-induced obesity; glucose transporter; mitochondria; olfactory bulb; potassium channel.
Figures
Similar articles
-
Modulating the Excitability of Olfactory Output Neurons Affects Whole-Body Metabolism.J Neurosci. 2022 Jul 27;42(30):5966-5990. doi: 10.1523/JNEUROSCI.0190-22.2022. Epub 2022 Jun 16. J Neurosci. 2022. PMID: 35710623 Free PMC article.
-
Olfactory bulb-targeted quantum dot (QD) bioconjugate and Kv1.3 blocking peptide improve metabolic health in obese male mice.J Neurochem. 2021 Jun;157(6):1876-1896. doi: 10.1111/jnc.15200. Epub 2020 Oct 20. J Neurochem. 2021. PMID: 32978815 Free PMC article.
-
Diet-induced obesity resistance of Kv1.3-/- mice is olfactory bulb dependent.J Neuroendocrinol. 2012 Aug;24(8):1087-95. doi: 10.1111/j.1365-2826.2012.02314.x. J Neuroendocrinol. 2012. PMID: 22435906 Free PMC article.
-
The Olfactory Bulb: A Metabolic Sensor of Brain Insulin and Glucose Concentrations via a Voltage-Gated Potassium Channel.Results Probl Cell Differ. 2010;52:147-57. doi: 10.1007/978-3-642-14426-4_12. Results Probl Cell Differ. 2010. PMID: 20865378 Free PMC article. Review.
-
Kv1.3 potassium channel blockade as an approach to insulin resistance.Expert Opin Ther Targets. 2005 Jun;9(3):571-9. doi: 10.1517/14728222.9.3.571. Expert Opin Ther Targets. 2005. PMID: 15948674 Review.
Cited by
-
Loss of odor-induced c-Fos expression of juxtaglomerular activity following maintenance of mice on fatty diets.J Bioenerg Biomembr. 2019 Feb;51(1):3-13. doi: 10.1007/s10863-018-9769-5. Epub 2018 Sep 11. J Bioenerg Biomembr. 2019. PMID: 30203289 Free PMC article.
-
Consumption of dietary fat causes loss of olfactory sensory neurons and associated circuitry that is not mitigated by voluntary exercise in mice.J Physiol. 2022 Mar;600(6):1473-1495. doi: 10.1113/JP282112. Epub 2021 Dec 7. J Physiol. 2022. PMID: 34807463 Free PMC article.
-
Nutrient Sensing: Another Chemosensitivity of the Olfactory System.Front Physiol. 2017 Jul 12;8:468. doi: 10.3389/fphys.2017.00468. eCollection 2017. Front Physiol. 2017. PMID: 28747887 Free PMC article. Review.
-
Elevated Anxiety and Impaired Attention in Super-Smeller, Kv1.3 Knockout Mice.Front Behav Neurosci. 2018 Mar 19;12:49. doi: 10.3389/fnbeh.2018.00049. eCollection 2018. Front Behav Neurosci. 2018. PMID: 29615878 Free PMC article.
-
Modulating the Excitability of Olfactory Output Neurons Affects Whole-Body Metabolism.J Neurosci. 2022 Jul 27;42(30):5966-5990. doi: 10.1523/JNEUROSCI.0190-22.2022. Epub 2022 Jun 16. J Neurosci. 2022. PMID: 35710623 Free PMC article.
References
-
- Baly D. L., Horuk R. (1988). The biology and biochemistry of the glucose transporter. Biochim. Biophys. Acta 947, 571–590. - PubMed
Grants and funding
LinkOut - more resources
Full Text Sources
Other Literature Sources
Molecular Biology Databases
Miscellaneous