. 2016 May 9:7:682.
doi: 10.3389/fmicb.2016.00682. eCollection 2016.

Dynamics of Actin Cables in Polarized Growth of the Filamentous Fungus Aspergillus nidulans

Affiliations

Dynamics of Actin Cables in Polarized Growth of the Filamentous Fungus Aspergillus nidulans

Anna Bergs et al. Front Microbiol. .

Abstract

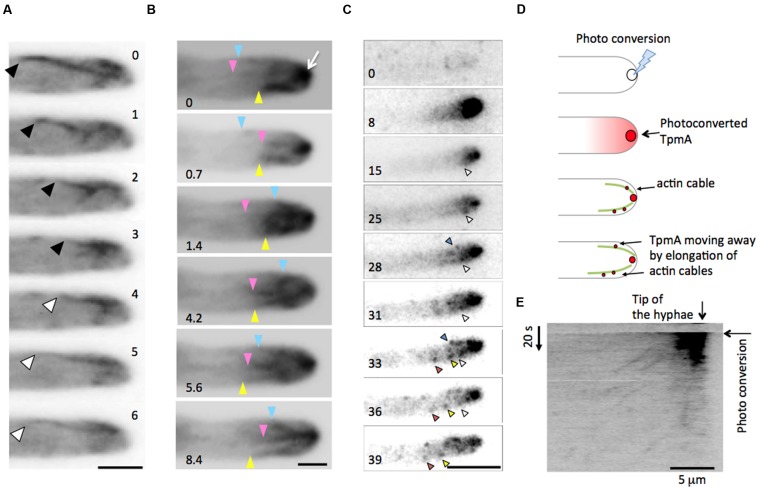
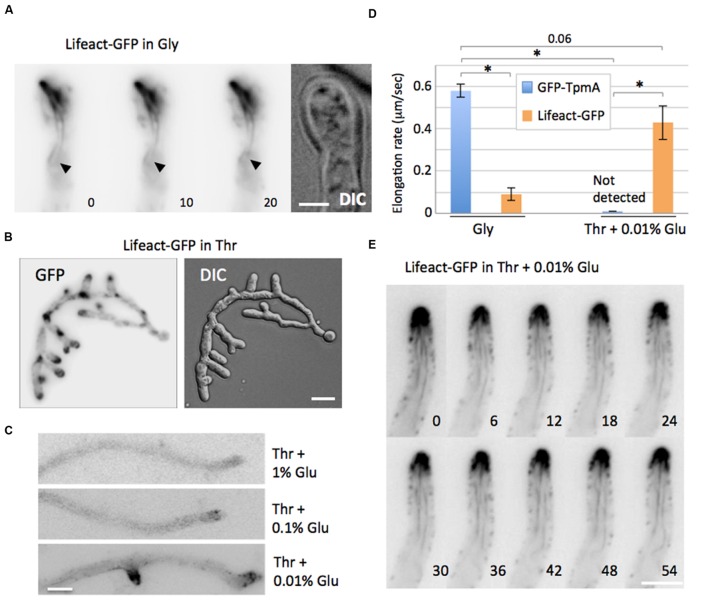
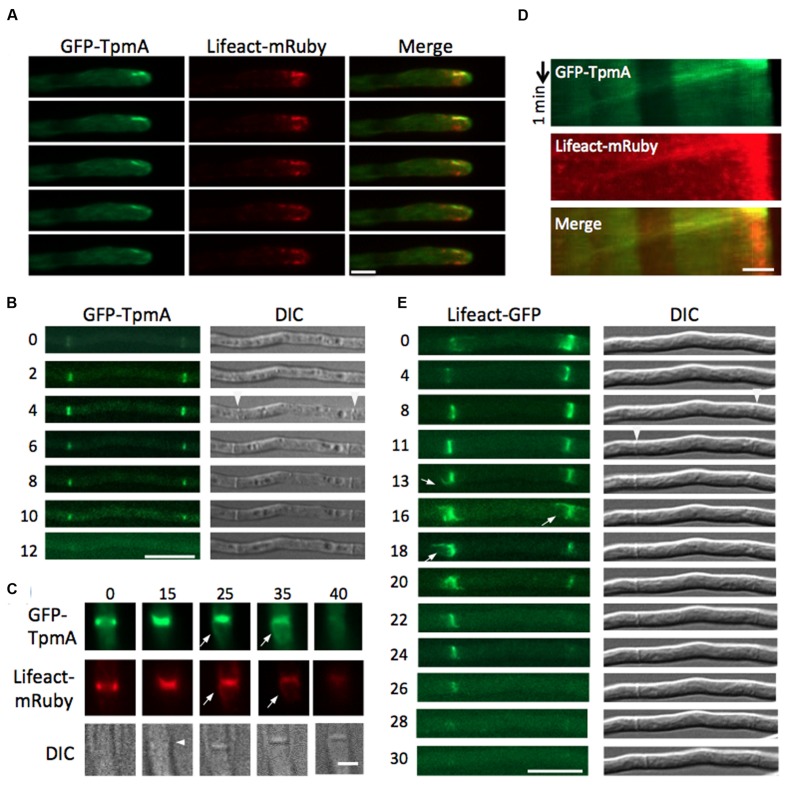
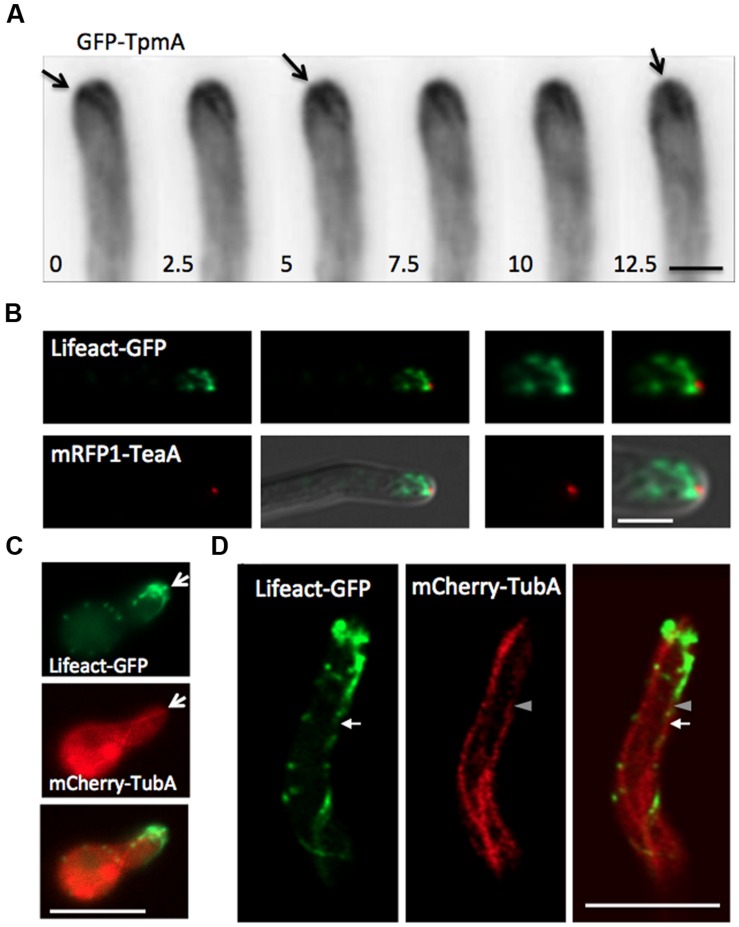
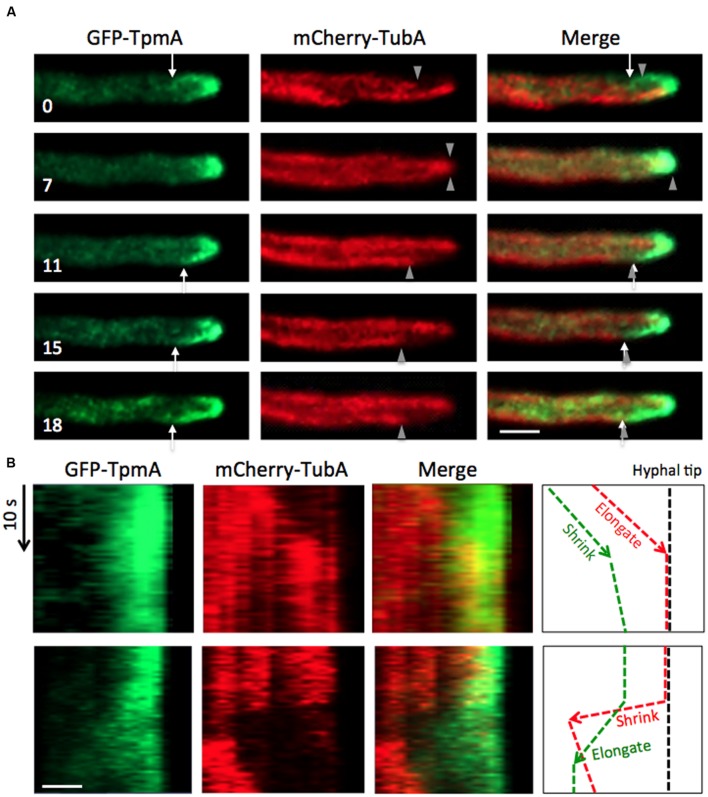
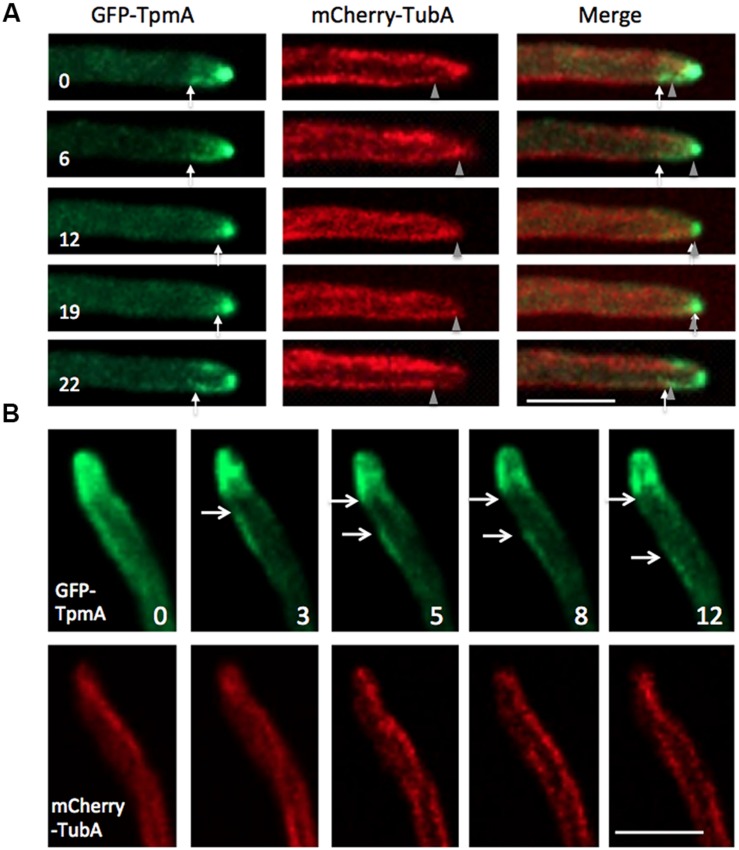
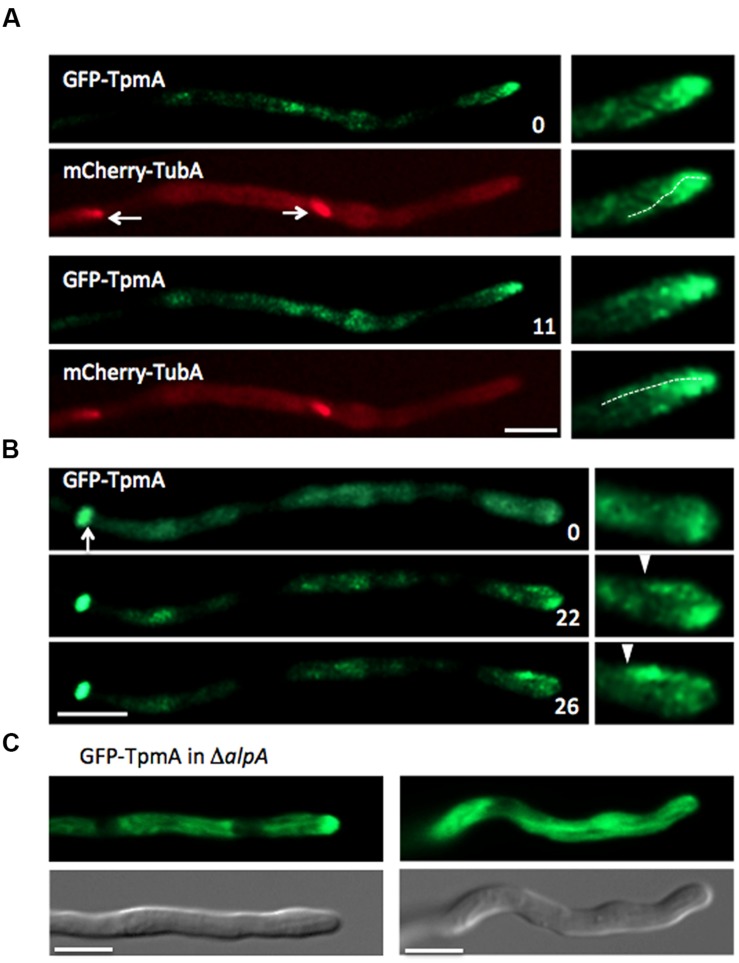
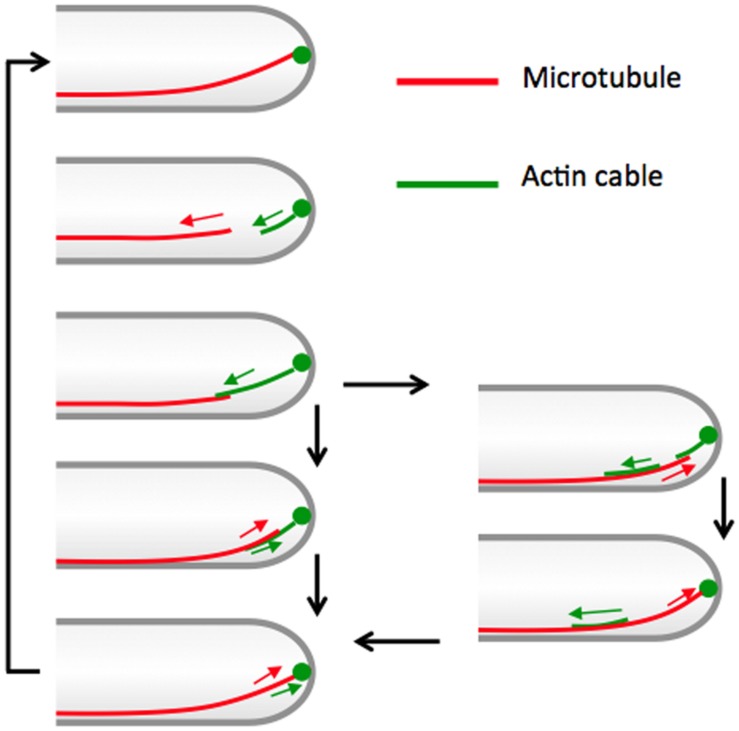
Highly polarized growth of filamentous fungi requires a continuous supply of proteins and lipids to the hyphal tip. This transport is managed by vesicle trafficking via the actin and microtubule cytoskeletons and their associated motor proteins. Particularly, actin cables originating from the hyphal tip are essential for hyphal growth. Although, specific marker proteins have been developed to visualize actin cables in filamentous fungi, the exact organization and dynamics of actin cables has remained elusive. Here, we observed actin cables using tropomyosin (TpmA) and Lifeact fused to fluorescent proteins in living Aspergillus nidulans hyphae and studied the dynamics and regulation. GFP tagged TpmA visualized dynamic actin cables formed from the hyphal tip with cycles of elongation and shrinkage. The elongation and shrinkage rates of actin cables were similar and approximately 0.6 μm/s. Comparison of actin markers revealed that high concentrations of Lifeact reduced actin dynamics. Simultaneous visualization of actin cables and microtubules suggests temporally and spatially coordinated polymerization and depolymerization between the two cytoskeletons. Our results provide new insights into the molecular mechanism of ordered polarized growth regulated by actin cables and microtubules.

Keywords: Aspergillus; actin; filamentous fungi; microtubule; polarity.


Figures

FIGURE 1
FIGURE 1
Tropomyosin TpmA as a marker for dynamic actin cable. (A) Elongation and shrinkage of an actin cable visualized by GFP-TpmA. Wide-field image sequence of a dynamic actin cable at the hyphal tip of Aspergillus nidulans expressing GFP-TpmA. Black arrowheads indicate shrinkage of the actin cable, whereas white arrowheads indicate elongation of the actin cable. The elapsed time is given in seconds. Scale bar: 2 μm. (B) Three actin cables showed elongation and shrinkage in an independent manner. Blue, pink, and yellow arrowheads indicate the minus ends of the actin cables. The elapsed time is given in seconds. Scale bar: 1 μm. (C–E) Tracking TpmA within the actin cable visualized by using the photoconvertible fluorescent protein mEosFPthermo. (C) Image sequences of photoconverted mEosFPthermo-TpmA. Photoconversion was done at t = 7 s for the duration of 1 s. The differently colored arrowheads indicate the movement of mEosFPthermo-TpmA. The elapsed time is given in seconds. Scale bar: 5 μm. (D) Schematic representation of the pulse-chase experiment. mEosFPthermo-TpmA at the hyphal tip was photoconverted to its red form by focused 405-nm light. Actin cables are elongated at the plus end close to the plasma membrane by formin adding G-actin to the plus end. The photoconverted red signals moved away from the hyphal tip by elongation of actin cables at the plus end. (E) Kymograph from image sequences (C). The profile shows that photoconverted mEosFPthermo-TpmA moves linearly in time, which is indicative of the active elongation of an actin cable. Vertical scale: 20 s, horizontal scale bar: 5 μm.
FIGURE 2
FIGURE 2
Expression level of Lifeact affects the dynamics of actin cables. (A) Actin cables visualized by Lifeact-GFP were stable. Lifeact-GFP was expressed under the alcA promoter in glycerol containing medium. The arrowheads indicate the position of the end of one actin cable. The elapsed time is given in seconds. Scale bar: 2 μm. (B) Elongation rates of actin cables quantified in the strains expressing GFP-TpmA (blue) or Lifeact-GFP (orange). GFP-TpmA or Lifeact-GFP were expressed under the alcA promoter in 2% glycerol medium (left) or 2% threonine and 0.01% glucose medium (right). The data are expressed as mean ± SEM (n = 76, 37, 10, and 13, respectively). Asterisks represent statistically significant difference, p < 0.01. (C) Overexpression of Lifeact-GFP. The strain expressing Lifeact-GFP was grown in medium containing 2% threonine. Scale bar: 5 μm. (D) Different expression levels of Lifeact-GFP under carbon catabolite repression. The strain expressing Lifeact-GFP was grown in medium containing 2% threonine plus 1, 0.1, or 0.01% glucose. Scale bar: 2 μm. (E) Wide-field image sequences of actin cables visualized by Lifeact-GFP in medium containing 2% threonine plus 0.01% glucose. The elapsed time is given in seconds. Scale bar: 5 μm.
FIGURE 3
FIGURE 3
Effect of Lifeact-mRuby on the actin structures visualized by GFP-TpmA. (A) GFP-TpmA co-localized with Lifeact-mRuby along stable actin cables. The strain expressing GFP-TpmA and Lifeact-mRuby was grown in glycerol containing medium. The elapsed time is given in seconds. Scale bar: 2 μm. (B) Kymograph of actin cable dynamics from image sequences (A). Vertical arrow: 1 min, horizontal scale bar: 2 μm. Wide-field image sequences of actin rings visualized by GFP-TpmA (C) or Lifeact-GFP (D) or GFP-TpmA and Lifeact-mRuby (E) in 2% glycerol containing medium. White arrowheads indicate septa recognized by DIC. The elapsed time is given in seconds. (C,D) Scale bar: 10 μm. (E) GFP-TpmA and Lifeact-mRuby localized to the actin ring prior to visibility of the septum in the DIC channel. Scale bar: 2 μm.
FIGURE 4
FIGURE 4
Localization of actin cables with cell end marker or microtubules. (A) Wide-field image sequences of an actin cable by GFP-TpmA. The plus end, visualized by GFP-TpmA, moved along the apical membrane. Arrows indicate the plus end of the actin cable moving along the apical membrane. The elapsed time is given in seconds. Scale bar: 2 μm. (B) The strain expressing Lifeact-GFP under the alcA promoter and mRFP1-TeaA under the native promoter was grown in 2% glycerol containing medium. Scale bar: 2 μm. (C,D) Localization of actin cables by Lifeact-GFP and microtubules by mCherry-TubA. Super-resolution microscopy image was constructed by Airyscan (ZEISS; D). Scale bars: 2 μm.
FIGURE 5
FIGURE 5
Coordinated elongation between actin cables and microtubules at hyphal tips. (A) Image sequences with approximately 200 ms interval taken via spinning-disk confocal microscopy of actin cables visualized by GFP-TpmA and microtubules visualized by mCherry-TubA. Arrows indicate the ends of actin cables. Arrowheads indicate the plus ends of microtubules. The elapsed time is given in seconds. Scale bar: 5 μm. (B) Kymograph of actin cable and microtubule dynamics from image sequences (A). Vertical arrow: 10 s, horizontal scale bar: 2 μm.
FIGURE 6
FIGURE 6
Related dynamics between actin cables and microtubules. (A,B) Image sequences with approximately 200 ms interval taken via spinning-disk confocal microscopy of actin cables visualized by GFP-TpmA and microtubules visualized by mCherry-TubA. Arrows indicate the ends of actin cables. Arrowheads indicate the plus ends of microtubules. The elapsed time is given in seconds. Scale bar: 5 μm.
FIGURE 7
FIGURE 7
Actin cable formation in mitosis, septum formation or DalpA strain. (A) Actin cables visualized by GFP-TpmA at the hyphal tip during mitosis (dotted lines, right). Spindles were visualized by mCherry-TubA (arrows). The elapsed time is given in seconds. Scale bar: 5 μm. (B) Actin cables visualized by GFP-TpmA at the hyphal tip during septum formation. The forming septum is shown by an arrow. The ends of actin cables are marked by arrowheads (right). The elapsed time is given in seconds. Scale bar: 5 μm. (C) The DalpA strain expressing GFP-TpmA under the alcA promoter was grown in 2% glycerol containing medium. Scale bars: 5 μm.
FIGURE 8
FIGURE 8
Working model of coordinated elongation between actin cables and microtubules. See text for details.

References

    1. Amberg D. C. (1998). Three-dimensional imaging of the yeast actin cytoskeleton through the budding cell cycle. Mol. Biol. Cell 9 3259–3262. 10.1091/mbc.9.12.3259 - DOI - PMC - PubMed
    1. Araujo-Bazan L., Penalva M. A., Espeso E. A. (2008). Preferential localization of the endocytic internalization machinery to hyphal tips underlies polarization of the actin cytoskeleton in Aspergillus nidulans. Mol. Microbiol. 67 891–905. 10.1111/j.1365-2958.2007.06102.x - DOI - PubMed
    1. Bartnicki-Garcia S., Bartnicki D. D., Gierz G., Lopez-Franco R., Bracker C. E. (1995). Evidence that Spitzenkörper behavior determines the shape of a fungal hypha: a test of the hyphoid model. Exp. Mycol. 19 153–159. 10.1006/emyc.1995.1017 - DOI - PubMed
    1. Basu R., Chang F. (2007). Shaping the actin cytoskeleton using microtubule tips. Curr. Opin. Cell Biol. 19 88–94. 10.1016/j.ceb.2006.12.012 - DOI - PubMed
    1. Berepiki A., Lichius A., Read N. D. (2011). Actin organization and dynamics in filamentous fungi. Nat. Rev. Microbiol. 9 876–887. 10.1038/nrmicro2666 - DOI - PubMed