

Quantitative Evaluation of Therapeutic Response by FDG-PET-CT in Metastatic Breast Cancer
- PMID: 27243012
- PMCID: PMC4861036
- DOI: 10.3389/fmed.2016.00019
Quantitative Evaluation of Therapeutic Response by FDG-PET-CT in Metastatic Breast Cancer
Abstract
Purpose: To assess the therapeutic response for metastatic breast cancer with (18)F-FDG position emission tomography (PET), this retrospective study aims to compare the performance of six different metabolic metrics with PERCIST, PERCIST with optimal thresholds, and an image-based parametric approach.
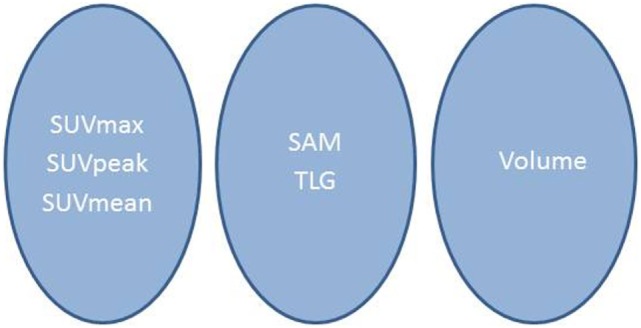
Methods: Thirty-six metastatic breast cancer patients underwent 128 PET scans and 123 lesions were identified. In a per-lesion and per-patient analysis, the performance of six metrics: maximum standardized uptake value (SUVmax), SUVpeak, standardized added metabolic activity (SAM), SUVmean, metabolic volume (MV), total lesion glycolysis (TLG), and a parametric approach (SULTAN) were determined and compared to the gold standard (defined by clinical assessment and biological and conventional imaging according RECIST 1.1). The evaluation was performed using PERCIST thresholds (for per-patient analysis only) and optimal thresholds (determined by the Youden criterion from the receiver operating characteristic curves).
Results: In the per-lesion analysis, 210 pairs of lesion evolutions were studied. Using the optimal thresholds, SUVmax, SUVpeak, SUVmean, SAM, and TLG were significantly correlated with the gold standard. SUVmax, SUVpeak, and SUVmean reached the best sensitivity (91, 88, and 83%, respectively), specificity (93, 95, and 97%, respectively), and negative predictive value (NPV, 90, 88, and 83%, respectively). For the per--patient analysis, 79 pairs of PET were studied. The optimal thresholds compared to the PERCIST threshold did not improve performance for SUVmax, SUVpeak, and SUVmean. Only SUVmax, SUVpeak, SUVmean, and TLG were correlated with the gold standard. SULTAN also performed equally: 83% sensitivity, 88% specificity, and NPV 86%.
Conclusion: This study showed that SUVmax and SUVpeak were the best parameters for PET evaluation of metastatic breast cancer lesions. Parametric imaging is helpful in evaluating serial studies.
Keywords: FDG; PERCIST; PET; SULTAN; breast cancer; parametric analysis; therapeutic evaluation.
Figures


Similar articles
-
FDG-PET/CT Versus Contrast-Enhanced CT for Response Evaluation in Metastatic Breast Cancer: A Systematic Review.Diagnostics (Basel). 2019 Aug 27;9(3):106. doi: 10.3390/diagnostics9030106. Diagnostics (Basel). 2019. PMID: 31461923 Free PMC article. Review.
-
Repeatability of Quantitative Whole-Body 18F-FDG PET/CT Uptake Measures as Function of Uptake Interval and Lesion Selection in Non-Small Cell Lung Cancer Patients.J Nucl Med. 2016 Sep;57(9):1343-9. doi: 10.2967/jnumed.115.170225. Epub 2016 Apr 21. J Nucl Med. 2016. PMID: 27103020
-
Diagnostic value of 18F-FDG PET/CT and MRI for intraspinal lesions: A comparative study.Med Int (Lond). 2021 Nov 30;1(5):23. doi: 10.3892/mi.2021.23. eCollection 2021 Nov-Dec. Med Int (Lond). 2021. PMID: 36698530 Free PMC article.
-
Lymph node standardized uptake values at pre-treatment 18F-fluorodeoxyglucose positron emission tomography as a valuable prognostic factor for distant metastasis in nasopharyngeal carcinoma.Br J Radiol. 2017 Mar;90(1071):20160239. doi: 10.1259/bjr.20160239. Epub 2016 Dec 23. Br J Radiol. 2017. PMID: 28008776 Free PMC article.
-
Metabolic Tumor Burden Assessed by Dual Time Point [18F]FDG PET/CT in Locally Advanced Breast Cancer: Relation with Tumor Biology.Mol Imaging Biol. 2017 Aug;19(4):636-644. doi: 10.1007/s11307-016-1034-x. Mol Imaging Biol. 2017. PMID: 27981471
Cited by
-
FDG-PET/CT Versus Contrast-Enhanced CT for Response Evaluation in Metastatic Breast Cancer: A Systematic Review.Diagnostics (Basel). 2019 Aug 27;9(3):106. doi: 10.3390/diagnostics9030106. Diagnostics (Basel). 2019. PMID: 31461923 Free PMC article. Review.
-
Significance of Metabolic Tumor Volume at Baseline and Reduction of Mean Standardized Uptake Value in 18F-FDG-PET/CT Imaging for Predicting Pathological Complete Response in Breast Cancers Treated with Preoperative Chemotherapy.Ann Surg Oncol. 2019 Jul;26(7):2175-2183. doi: 10.1245/s10434-019-07325-8. Epub 2019 Apr 2. Ann Surg Oncol. 2019. PMID: 30941655 Free PMC article.
-
Automatic Segmentation of Metastatic Breast Cancer Lesions on 18F-FDG PET/CT Longitudinal Acquisitions for Treatment Response Assessment.Cancers (Basel). 2021 Dec 26;14(1):101. doi: 10.3390/cancers14010101. Cancers (Basel). 2021. PMID: 35008265 Free PMC article.
-
Predictive markers for efficacy of everolimus plus exemestane in patients with luminal HER2-negative metastatic breast cancer.Med Oncol. 2018 Mar 8;35(4):48. doi: 10.1007/s12032-018-1112-9. Med Oncol. 2018. PMID: 29520681
-
State of the Art in 2022 PET/CT in Breast Cancer: A Review.J Clin Med. 2023 Jan 27;12(3):968. doi: 10.3390/jcm12030968. J Clin Med. 2023. PMID: 36769616 Free PMC article. Review.
References
-
- Luporsi E. Le cancer du sein métastatique. Définitions actuelles, épidémiologie, présentations cliniques. Springer; (2007). Available from: http://documents.irevues.inist.fr/bitstream/handle/2042/15908/1/SFSPM_20...
LinkOut - more resources
Full Text Sources
Other Literature Sources