. 2016 May 31:6:26996.
doi: 10.1038/srep26996.

The Statistical Value of Raw Fluorescence Signal in Luminex xMAP Based Multiplex Immunoassays

Affiliations

The Statistical Value of Raw Fluorescence Signal in Luminex xMAP Based Multiplex Immunoassays

Edmond J Breen et al. Sci Rep. .

Abstract

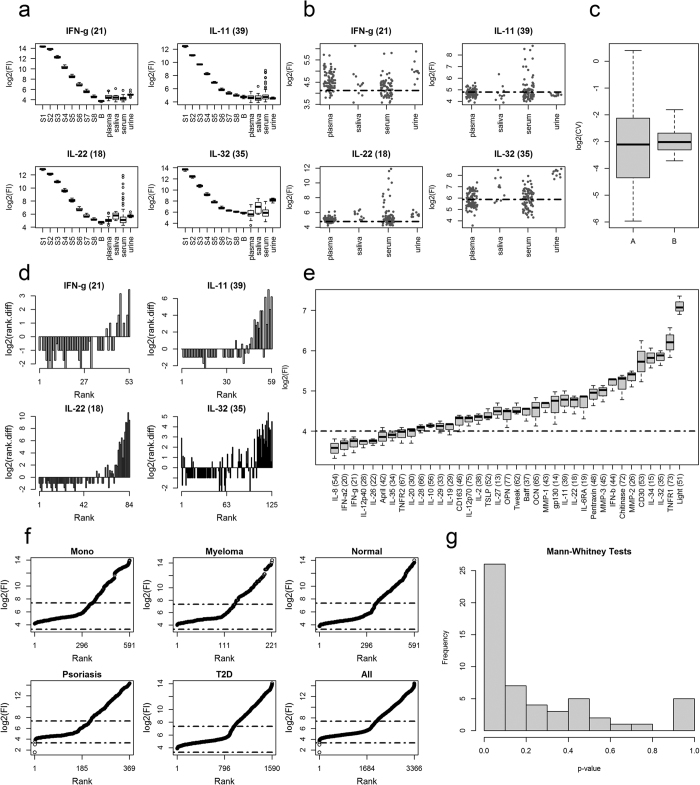
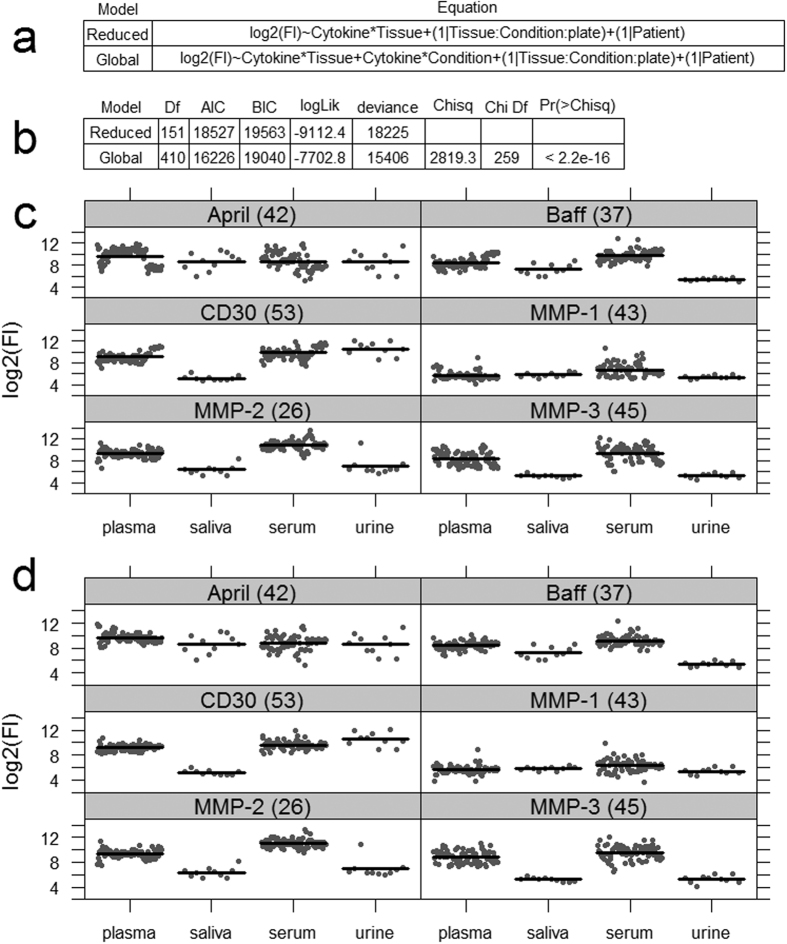
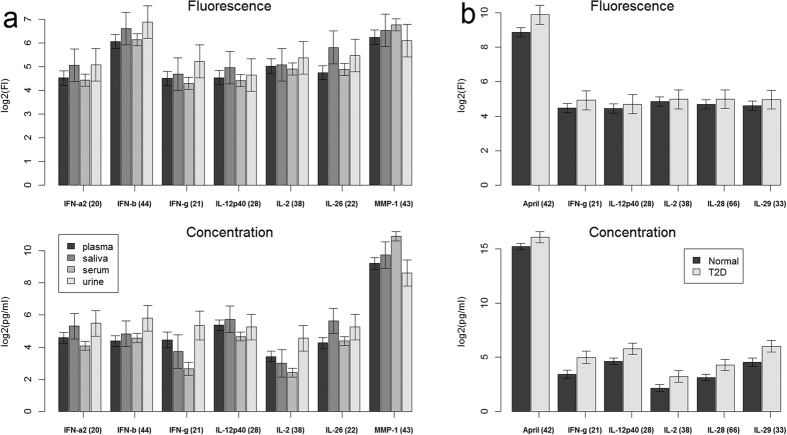
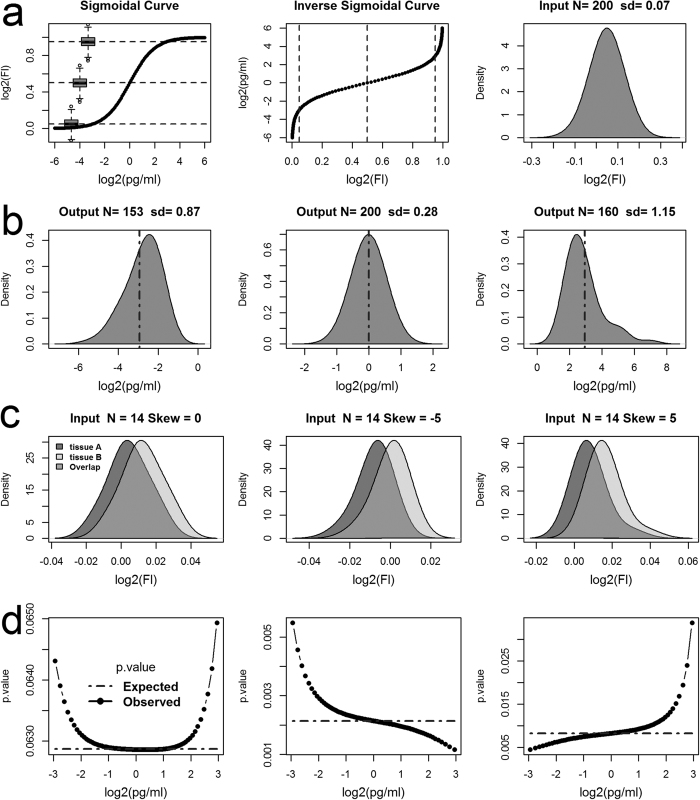
Tissue samples (plasma, saliva, serum or urine) from 169 patients classified as either normal or having one of seven possible diseases are analysed across three 96-well plates for the presences of 37 analytes using cytokine inflammation multiplexed immunoassay panels. Censoring for concentration data caused problems for analysis of the low abundant analytes. Using fluorescence analysis over concentration based analysis allowed analysis of these low abundant analytes. Mixed-effects analysis on the resulting fluorescence and concentration responses reveals a combination of censoring and mapping the fluorescence responses to concentration values, through a 5PL curve, changed observed analyte concentrations. Simulation verifies this, by showing a dependence on the mean florescence response and its distribution on the observed analyte concentration levels. Differences from normality, in the fluorescence responses, can lead to differences in concentration estimates and unreliable probabilities for treatment effects. It is seen that when fluorescence responses are normally distributed, probabilities of treatment effects for fluorescence based t-tests has greater statistical power than the same probabilities from concentration based t-tests. We add evidence that the fluorescence response, unlike concentration values, doesn't require censoring and we show with respect to differential analysis on the fluorescence responses that background correction is not required.


Figures

Figure 1
Figure 1. Fluorescence LOD analysis.
(a) Tissue test sample analyte fluorescence distributions against the associated standards (S1, …, S8) and blanks (B). Standards represent the fluorescence responses obtained from a set of standards of known concentrations for each analyte under investigation. The blank represents the test kits fluorescence response when its target analyte is missing. The background matrix used for the standards and blanks is typically, and as here is, the assay’s diluent. (b) Tissue fluorescence scatterplots for 4 analytes. The dashed horizontal line in each plot in (b) is the threshold (censor) determined by Bio-Rad’s Manager Software as the lower limit of detection. (c) Box plot Log2 distributions for the fluorescence response coefficient of variation (CV) above (A) and below (B) the associated LOD. The log of the values is used because there are two large outliers in the above (A) distribution. (d) The log2 of the rank differences as a function of rank; that is: rank.diff(r) = Fl(r + 1) − Fl(r); where r is a rank, an integer value, from the set: r∈{1,…, n−1}, and where n is the number of ranks in the set 1:n. Rank assigns to each unique fluorescence response an ordering from lowest to highest response such that Fl(rank) < Fl(rank +1) and where Fl(rank) is the fluorescence response associated by rank. (e) Analyte blank response distributions in rank order. The dashed horizontal line represents the level at which most if not all the patient fluorescence responses are above. (f) Patient sample fluorescence responses for plasma in rank order and according to condition. The lower and upper dashed horizontal lines represents the median response from the minimum (IL-8) and maximum (Light) blank responses. Abbreviations: Mono = mononucleosis, and T2D = type 2 diabetes. (g) Histogram of 54 Mann-Whitney test p-values obtained from cytokine tissue pairwise comparisons for the 9 cytokines that have median test sample response less than its lowest standard (S8): IFN-g (21), IL-10 (56), IL-11 (39), IL-12p40 (28), IL-2 (38), IL-20 (30), IL-22 (18), IL-28 (66), IL-32 (35).
Figure 2
Figure 2. Statistical model for analyte expression.
(a) Two linear mixed-effects models in R-notation. Main fixed effects are Cytokine, 37 levels, Tissue, 4 levels, and Condition with 8 levels. (b) Gives the results of a statistical comparison of the reduced model against the global model. AIC Akaike’s Information Criterion, BIC Bayesian Information Criterion, and the smaller they are the better the model fit. Comparisons between reduced, (c), and global mixed-effects models (d) for selected analytes using regression conditional plots. Conditional plots show the relationship between the outcome and explanatory/conditional variables to be viewed as other effects are held constant. Note for the global model, (d), the cluster of points (residuals) around each conditional mean response (dark horizontal line) is tighter than that seen in the reduced model, (c). Both models contain the same number of samples per tissue. For brevity, only results for 9 of the 37 analytes are given, however, the same comparison but for all 37 analytes are given in Supplementary Fig. S2. Since the conditional residuals are reasonably scattered above and below their respective means, implies that either model is a reasonable fit to the data.
Figure 3
Figure 3. Comparison of analyte expression fluorescence and concentration levels.
Adjusted means obtained for selected analytes from the global mixed-effects models. (a) Analyte means adjusted for condition, plate and patient differences across tissue. (b) Analyte means adjusted for tissue, plate and patient differences across conditions: Normal and T2D (Type 2 Diabetes). Error bars represent 95% confidence.
Figure 4
Figure 4. Modelling the mapping of fluorescence responses to concentration values.
(a) A Simulations of mapping a hypothetical fluorescence response (Fl) distribution to concentration values (pg/ml) through a sigmoidal curve. (a) Gives the concentration response curve (sigmoidal curve), the corresponding inverse sigmoidal curve and the input fluorescence distribution. Note, the log2(Fl) responses are normalized to lie between 0 and 1. The boxplots overlaid on the sigmoidal curve show the relative fluorescence range/scale of the input distribution at low (0.05), middle (0.5; EC50 response) and high (0.95) responses levels against the concentration curve (for comparison see Supplementary Fig. S1). The dashed horizontal and vertical lines on the sigmoidal and the inverse curve respectively highlight these levels. (b) Shows the corresponding output concentration distributions after mapping the input distribution in (a) to pg/ml when the input distribution is centred at low, middle, or high log2(Fl) responses. The vertical dashed lines overlaid on the output distributions represent the expected mean concentration as obtained from the input mean fluorescence response. (c) Simulations of mapping the log2(Fl) responses from two hypothetical tissues A and B to pg/ml is given. Three input distribution pairs that differ only with respect to their level of skewness (0, −5, and 5 respectively). The distance between the input means in each pair was set to achieve a Cohen’s effect size of 0.8. (d) Gives the resulting p-values obtained from two-sample t-tests on the output concentration distributions, as the input distributions (c) are mapped to concentration values from low (0.05) to high (0.95) response levels; step size approx. 0.01 log2(Fl) units. Note, the expected p-values in (d) represent the results obtained from t-tests on the input fluorescence distributions after each translation along fluorescence axis.

References

    1. Tighe P. J., Ryder R. R., Todd I. & Fairclough L. C. ELISA in the multiplex era: potentials and pitfalls. Proteomics Clin Appl 9, 406–422, 10.1002/prca.201400130 (2015). - DOI - PMC - PubMed
    1. Rosenberg-Hasson Y., Hansmann L., Liedtke M., Herschmann I. & Maecker H. T. Effects of serum and plasma matrices on multiplex immunoassays. Immunologic research 58, 224–233, 10.1007/s12026-014-8491-6 (2014). - DOI - PMC - PubMed
    1. Breen E. C. et al. Multisite comparison of high-sensitivity multiplex cytokine assays. Clinical and vaccine immunology: CVI 18, 1229–1242, 10.1128/CVI.05032-11 (2011). - DOI - PMC - PubMed
    1. Valekova I., Skalnikova H. K., Jarkovska K., Motlik J. & Kovarova H. Multiplex immunoassays for quantification of cytokines, growth factors, and other proteins in stem cell communication. Methods Mol Biol 1212, 39–63, 10.1007/7651_2014_94 (2015). - DOI - PubMed
    1. Wong H. L. et al. Reproducibility and correlations of multiplex cytokine levels in asymptomatic persons. Cancer epidemiology, biomarkers & prevention : a publication of the American Association for Cancer Research, cosponsored by the American Society of Preventive Oncology 17, 3450–3456, 10.1158/1055-9965.EPI-08-0311 (2008). - DOI - PubMed

Publication types

MeSH terms

LinkOut - more resources