. 2016 May 31;11(5):e0156547.
doi: 10.1371/journal.pone.0156547. eCollection 2016.

Modeling Effects of RNA on Capsid Assembly Pathways via Coarse-Grained Stochastic Simulation

Affiliations

Modeling Effects of RNA on Capsid Assembly Pathways via Coarse-Grained Stochastic Simulation

Gregory R Smith et al. PLoS One. .

Abstract

The environment of a living cell is vastly different from that of an in vitro reaction system, an issue that presents great challenges to the use of in vitro models, or computer simulations based on them, for understanding biochemistry in vivo. Virus capsids make an excellent model system for such questions because they typically have few distinct components, making them amenable to in vitro and modeling studies, yet their assembly can involve complex networks of possible reactions that cannot be resolved in detail by any current experimental technology. We previously fit kinetic simulation parameters to bulk in vitro assembly data to yield a close match between simulated and real data, and then used the simulations to study features of assembly that cannot be monitored experimentally. The present work seeks to project how assembly in these simulations fit to in vitro data would be altered by computationally adding features of the cellular environment to the system, specifically the presence of nucleic acid about which many capsids assemble. The major challenge of such work is computational: simulating fine-scale assembly pathways on the scale and in the parameter domains of real viruses is far too computationally costly to allow for explicit models of nucleic acid interaction. We bypass that limitation by applying analytical models of nucleic acid effects to adjust kinetic rate parameters learned from in vitro data to see how these adjustments, singly or in combination, might affect fine-scale assembly progress. The resulting simulations exhibit surprising behavioral complexity, with distinct effects often acting synergistically to drive efficient assembly and alter pathways relative to the in vitro model. The work demonstrates how computer simulations can help us understand how assembly might differ between the in vitro and in vivo environments and what features of the cellular environment account for these differences.


Conflict of interest statement

Competing Interests: The authors have declared that no competing interests exist.

Figures

Fig 1
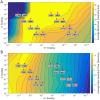
Fig 1. Contour plots of maximum assembly size and assembly time over the space of rate parameters.
(A) Contour plot of the average maximum assembly size for 54 rate parameter grid points and 16 RNA effect combinations (red dots). The colorbar shows average maximum assembly size. A completed CCMV capsid consists of 90 subunits. (B) Contour plot of the average time to reach a maximum assembly size for a simulation over the same grid points and effect combinations. The colorbar shows time in seconds. The four-digit binary codes for simulations are as explained in Table 1, with a zero in each bit corresponding to absence of a given RNA effect and a one in that bit to presence of the corresponding effect. The first digit represents RNA-RNA, the second Compression, the third RNA-protein, and the fourth Concentration.
Fig 2
Fig 2. Comparing maximum assembly size and assembly time.
Log-scale scatter plot of maximum assembly size versus the time to reach that assembly size averaged over 100 simulation runs for each RNA effect combination. Boxes surround clusters of RNA effect combinations that have similar relationships between maximum assembly size and assembly time. The four-digit binary codes for simulations are as explained in Table 1, with a zero in each bit corresponding to absence of a given RNA effect and a one in that bit to presence of the corresponding effect. The first digit represents RNA-RNA, the second Compression, the third RNA-protein, and the fourth Concentration.
Fig 3
Fig 3. Simulated light scattering curves for CCMV capsid assembly under different representative combinations of RNA effects.
Plot comparing simulated light scattering curves for CCMV capsid assembly averaged over 200 individual simulation trajectories for four representative combinations of RNA effects: hollow capsid (no effects considered), the two negative RNA effects (Compression + RNA-RNA), the two positive RNA effects (RNA-Protein + Concentration) and the combination of all four RNA effects. Time on the x axis is shown on a log scale.
Fig 4
Fig 4. Mass fraction plots for representative combinations of RNA effects.
Mass fraction plots for (A) hollow CCMV capsid assembly, (B) CCMV capsid assembly with all combined RNA effects, (C) CCMV capsid assembly under both negative effects (1100), and (D) CCMV capsid assembly under both positive effects (0011). Each plot measures the mass fraction of each potential assembly size from individual monomers to completed capsids at each time point in a single simulation run. Approximate locations of putative nucleation events are labeled in each plot. Note that the time axis is on a different scale for each plot due to the very different timescales of the assembly reaction under the different effects models.
Fig 5
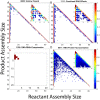
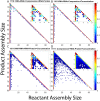
Fig 5. Frequency matrix plots for representative combinations of RNA effects.
Frequency matrix plots for (a) hollow CCMV capsid assembly, (b) CCMV capsid assembly with all combined RNA effects, (c) CCMV capsid assembly under both negative RNA effects (1100), and (d) CCMV capsid assembly under both positive RNA effects. In each plot, each row corresponds to a product size and each column to reactant sizes that produce that product. Pixel color in each position corresponds to the frequency with which the given reactant size is used to produce the given product size. Insets within each plot expand the upper-left corner of the main plot, corresponding to products of size 20 or smaller, to better visualize pathways involved in production of small oligomers.
Fig 6
Fig 6. Comparing Influence of Individual RNA Effects on Averaged Assembly Rate.
Simulated light scattering curves for CCMV capsid assembly under each individual RNA effect as well as the hollow capsid and combined RNA effects case. Fig 6A shows the entire simulation time course while Fig 6B shows the first second. Time on the x axis is shown on a log scale.
Fig 7
Fig 7. Comparing Influence of Two RNA Effects on Averaged Assembly Rate.
Simulated light scattering curves for CCMV capsid assembly under all combinations of two RNA effects as well as the hollow capsid and combined RNA effects case. Fig 7A shows the entire simulation time course while Fig 7B shows the first five seconds. Time on the x axis is shown on a log scale.
Fig 8
Fig 8. Comparing Influence of Three RNA Effects on Averaged Assembly Rate.
Simulated light scattering curves for CCMV capsid assembly under all combinations of three RNA effects as well as the hollow capsid and combined RNA effects case. Fig 8A shows the entire simulation time course while Fig 8B shows the first second. Time on the x axis is shown on a log scale.
Fig 9
Fig 9. Mass fraction plots for CCMV capsid assembly with individual RNA effects.
Mass fraction plots for single trajectories of CCMV capsid assembly upon applying each effect: (A) RNA-RNA, (B) Compression, (C) RNA-protein, (D) Concentration. The negative RNA-RNA effect prevents any large intermediates from being formed, while the other three still allow for capsids to be completed.
Fig 10
Fig 10. Mass fraction plots for CCMV capsid assembly with combinations of two RNA effects.
Combinations are described by a four digit binary code as explained in Table 1, where a 1 means an effect has been turned on and a 0 means an effect has been turned off. The first digit represents RNA-RNA, the second Compression, the third RNA-protein, and the fourth Concentration. (A) is 1010, (B) is 1001, (C) is 0110, (D) is 0101.
Fig 11
Fig 11. Mass fraction plots for CCMV capsid assembly with combinations of three RNA effects.
Combinations are described by a four digit binary code as explained in Table 1 where a 1 means an effect has been turned on and a 0 means an effect has been turned off. The first digit represents RNA-RNA, the second Compression, the third RNA-protein, and the fourth Concentration. (A) is 1110, (B) is 1101, (C) is 1011, (D) is 0111.
Fig 12
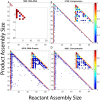
Fig 12. Frequency matrix plots for CCMV capsid assembly with individual RNA effects.
Frequency matrix plots averaged over 200 simulation runs for CCMV capsid assembly upon applying: (A) RNA- RNA, (B) Compression, (C) RNA-protein, (D) Concentration. In each plot, each row corresponds to a product size and each column to reactant sizes that produce that product. Pixel color in each position corresponds to the frequency with which the given reactant size is used to produce the given product size. Insets within each plot expand the upper-left corner of the main plot, corresponding to products of size 20 or smaller, to better visualize pathways involved in production of small oligomers.
Fig 13
Fig 13. Frequency matrix plots for CCMV capsid assembly with combinations of two RNA effects.
Combinations are described by a four digit binary code as in Table 1 where a 1 means an effect has been turned on and a 0 means an effect has been turned off. The first digit represents RNA-RNA, the second Compression, the third RNA-protein, and the fourth Concentration.: (A) is 1010, (B) is 1001, (C) is 0110, (D) is 0101. In each plot, each row corresponds to a product size and each column to reactant sizes that produce that product. Pixel color in each position corresponds to the frequency with which the given reactant size is used to produce the given product size. Insets within each plot expand the upper-left corner of the main plot, corresponding to products of size 20 or smaller, to better visualize pathways involved in production of small oligomers.
Fig 14
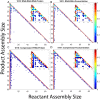
Fig 14. Frequency matrix plots for CCMV capsid assembly with combinations of three RNA effects.
Combinations are described by a four digit binary code as in Table 1 where a 1 means an effect has been turned on and a 0 means an effect has been turned off. The first digit represents RNA-RNA, the second Compression, the third RNA-protein, and the fourth Concentration. (A) is 1110, (B) is 1101, (C) is 1011, (D) is 0111. In each plot, each row corresponds to a product size and each column to reactant sizes that produce that product. Pixel color in each position corresponds to the frequency with which the given reactant size is used to produce the given product size. Insets within each plot expand the upper-left corner of the main plot, corresponding to products of size 20 or smaller, to better visualize pathways involved in production of small oligomers.

Similar articles

Cited by

References

    1. Zlotnick A. To build a virus capsid. An equilibrium model of the self assembly of polyhedral protein complexes. J. Mol. Biol. 1994:241: 59–67. - PubMed
    1. Zlotnick A, Johnson JM, Endres D. A theoretical model successfully identifies features of hepatitis B virus capsid assembly. Biochemistry. 1999:38: 14644–14652. - PubMed
    1. Moisant P, Neeman H, Zlotnick A. Exploring the paths of (virus) assembly. Biophys. J. 2010:99: 1350–1357. 10.1016/j.bpj.2010.06.030 - DOI - PMC - PubMed
    1. Tsiang M, Niedziela-Majka A, Hung M, Jin D, Hu E, Yant S, et al. A trimer of dimers is the basic building block for human immunodeficiency virus-1 capsid assembly. Biochemistry. 2012:51: 4416–4428. - PubMed
    1. Hagan MF, Elrad OM. Understanding the concentration dependence of viral capsid assembly kinetics—the origin of the lag time and identifying the critical nucleus size. Biophys. J. 2010:98: 1065–1074. 10.1016/j.bpj.2009.11.023 - DOI - PMC - PubMed

LinkOut - more resources