. 2016 May 31:6:26792.
doi: 10.1038/srep26792.

Preserved Nephrogenesis Following Partial Nephrectomy in Early Neonates

Affiliations

Preserved Nephrogenesis Following Partial Nephrectomy in Early Neonates

Yuhei Kirita et al. Sci Rep. .

Abstract

Reconstitution of total nephron segments after resection in the adult kidney has not been achieved; however, whether the neonatal kidney can maintain the capacity for neo-nephrogenesis after resection is unknown. We performed partial resection of the kidney in neonatal rats on postnatal days 1 (P1x kidney) and 4 (P4x kidney) and examined morphological changes and relevant factors. The P1x kidney bulged into the newly formed cortex from the wound edge, while nephrogenesis failure was prominent in the P4x kidney. Twenty-eight days post-resection, the glomerular number, cortex area, and collecting duct were preserved in the P1x kidney, whereas these parameters were markedly decreased in the P4x kidney. During normal development, Six2 expression and Six2+ nephron progenitor cells in the cap mesenchyme both rapidly disappear after birth. However, time course analysis for the P1x kidney showed that Six2 expression and Six2+ cells were well preserved in the tissue surrounding the resected area even 2 days after resection. In conclusion, our results indicate that kidneys in early neonate rats retain the capability for neo-nephrogenesis after resection; however, this ability is lost soon after birth, which may be attributed to a declining amount of Six2+ cells.


Figures
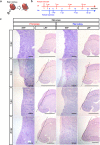
Figure 1
Figure 1. The P1x kidney generates the tissue from the edge of the wound after partial nephrectomy.
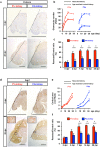
(a) The right kidney at the inferior pole was partially resected in neonatal rats at postnatal day 1 (P1) or 4 (P4) under hypothermic anesthesia. An incision was made in the right flank and the right kidney was partially resected using iridectomy scissors. (b) Experimental scheme. After partial resection of the kidney, pups were sacrificed at 2, 7, 14, and 28 days post-resection (dpr). (c) Periodic Acid Schiff’s (PAS) staining of the kidney at 0, 2, 7, and 28 dpr. Dotted straight lines indicate the resection plane and dotted curves indicate the cortico-medullary junction (scale bars, 100 μm in HPF and 2 mm in LPF).
Figure 2
Figure 2. Newly formed glomeruli and tubules after partial nephrectomy of the P1x rat kidney.
(a) Immunostaining of podocin as a glomerular marker. Dotted lines indicate the resection plane (scale bars, 2 mm). In the P1x kidney, the tissue covering the resected area contained glomeruli. In contrast, the newly generated tissue of the P4x kidney did not contain the glomerulus. (b) Time course analysis of glomerular number under the resection plane in the maximal cross-sectional surface. (c) Resected/control ratio of glomerulus number. (d) Immunostaining of AQP1 as a proximal tubule marker. Dotted lines indicate the resection plane (scale bars, 2 mm) and high magnification pictures are shown in small squares. In the P1x kidney, the tissue covering the resected area contained robust AQP1+ tubules, whereas this was not seen in the P4x kidney (e) Time course analysis of the cortical area under the resection plane in the maximal cross-sectional surface. (f) Resected/control ratio of cortical area. Data represent mean ± SE (n = 3). *P < 0.05.
Figure 3
Figure 3. Newly formed collecting ducts after partial nephrectomy of the P1x rat kidney.
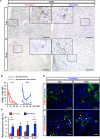
(a) Immunostaining of DBA as a collecting duct marker. Arrows indicate the resected surface. Arrowheads indicate collecting ducts pulled into the resected area due to the scar constriction process in the P4x kidney. Scale bars, 100 μm. (b) Time course analysis of the number of DBA+ tubules crossing a boundary line between the cortex and medulla under the resection plane in the maximal cross-sectional surface. (c) Resected/control ratio of DBA+ tubules. Data represent mean ± SE (n = 3). *P < 0.05.
Figure 4
Figure 4. The P1x kidney preserves proliferative capacity after partial nephrectomy.
(a) Time course analysis of the number of PHH3+ cells under the resection plane on the maximal cross-sectional surface. (b) Resected/control ratio of PHH3+ cells. (c,e) Time course analysis of the number of PHH3+ AQP1+ cells and PHH3+ DBA+ for P1x and P4x kidney. (d,f) Resected/control ratio of PHH3+ AQP1+ cells and PHH3+ DBA+. Data represent mean of sample averages ± SE (n = 3). *P < 0.05.
Figure 5
Figure 5. The P1x kidney preserves anti-apoptotic capacity after partial nephrectomy.
(a) Immunohistochemistry of TUNEL for detection of apoptosis. Arrowheads indicate TUNEL+ cells. (b) Time course analysis of the number of TUNEL+ cells under the resection plane on the maximal cross-sectional surface. (d) Resected/control ratio of TUNEL+ cells. Data represent mean of sample averages ± SE (n = 3). *P < 0.05. (d) Analysis of origin of apoptotic cells in the P4x kidney. Co-staining of TUNEL and AQP1 or DBA for detection of apoptotic cells at 2 dpr and 28 dpr in P4x kidneys. Scale bars, 100 μm.
Figure 6
Figure 6. Six2 gene expression and higher incidence of Six2+ cells in the normal kidney on P1 versus P4.
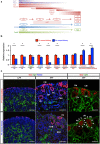
(a) An illustration of temporal gene expression patterns during renal development. PS, pluripotent stem cell; IM, intermediate mesoderm; UB, ureteric bud; SP, Stromal progenitor cell; MM, metanephric mesenchyme; MET. Mesenchymal-epithelial transition; NP, nephron progenitor cell; RV, renal vesicle; DT, distal tubule; PT, proximal tubule; Pod, podocyte; CD collecting duct; Mes, mesangial cell. (b) The expression of marker genes for the developing kidney in P1 and P4 determined by qRT-PCR. The expression of each transcript relative to GAPDH expression is presented as the mean ± SE (n = 3) *P < 0.05. (c) Immunofluorescence staining for Six2 and Aqp1 in P1 and P4 kidneys. Scale bars in low power field (LPF), 200 μm; in high power field (HPF), 50 μm. Six2+ cells are present in the peripheral layer in both P1 and P4 normal kidneys; however, gene expression in the P4 normal kidney is much weaker than in the P1 normal kidney. Cap mesenchyme formation is observed in the P1 normal kidney but not in the P4 normal kidney. Immunostaining for collagen IV showed that renal vesicles are surrounded by a tubular basement membrane (white arrowheads), whereas this was not seen in the cap mesenchyme. CM, cap mesenchyme; PA, pretubular aggregate; RV, renal vesicle; CSB, Comma-shaped body; SSB, S-shaped body; UB, ureteric bud.
Figure 7
Figure 7. Partial nephrectomy in early neonates reinforces Six2 expression, preserves the cap mesenchyme structure in the edge of the wound, and generates new nephrons until 4 dpr.
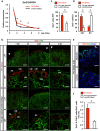
(a) Six2 expression dynamics in P1x and age-matched control kidneys determined by qRT-PCR. The relative expression of each transcript to GAPDH expression is presented as the mean ± SE (n = 3). Six2 expression rapidly decreases in the normal kidney; in contrast, the resected kidney preserves Six2 expression until 4 dpr. (b) Immunofluorescence staining of Six2 and ColIV in P1x and age-matched control kidneys. Arrowheads indicate the center of the resection plane. Six2+ cells localize on the anterior of newly generated tissues at 2 dpr, whereas they are scarcely observed in the age-matched control kidney. Six2+ cells disappear at 4 dpr in both resected and control kidneys. CM, cap mesenchyme; PA, pretubular aggregate; RV, renal vesicle. (c) The amount of Six2+ cells was the most prominent at 2 dpr in P1x kidneys. (d) The Six2+ cap mesenchyme was significantly preserved at 2 dpr in P1x kidneys. (e) Representative images of double staining for PHH3 and Six2 at 2 dpr. (f) Quantification of PHH3+ Six2+ cells showed that the number of cells was significantly larger in the P1x kidney.

Similar articles

Cited by

References

    1. Birnbaum K. D. & Alvarado A. S. Slicing across Kingdoms: Regeneration in Plants and Animals. Cell 132, 697–710, 10.1016/j.cell.2008.01.040 (2008). - DOI - PMC - PubMed
    1. Stocum D. L. & Cameron J. A. Looking proximally and distally: 100 years of limb regeneration and beyond. Dev. Dyn. 240, 943–968, 10.1002/dvdy.22553 (2011). - DOI - PubMed
    1. Knapp D. & Tanaka E. M. Regeneration and reprogramming. Curr. Opin. Genet. Dev. 22, 485–493, 10.1016/j.gde.2012.09.006 (2012). - DOI - PubMed
    1. Lehoczky J. A., Robert B. & Tabin C. J. Mouse digit tip regeneration is mediated by fate-restricted progenitor cells. Proc. Natl. Acad. Sci. USA 108, 20609–20614, 10.1073/pnas.1118017108 (2011). - DOI - PMC - PubMed
    1. Schon E. A. Tales from the crypt. J. Clin. Invest. 112, 1312–1316, 10.1172/JCI20249 (2003). - DOI - PMC - PubMed

LinkOut - more resources