

Rates of Prevalent HIV Infection, Prevalent Diagnoses, and New Diagnoses Among Men Who Have Sex With Men in US States, Metropolitan Statistical Areas, and Counties, 2012-2013
- PMID: 27244769
- PMCID: PMC4887662
- DOI: 10.2196/publichealth.5684
Rates of Prevalent HIV Infection, Prevalent Diagnoses, and New Diagnoses Among Men Who Have Sex With Men in US States, Metropolitan Statistical Areas, and Counties, 2012-2013
Abstract
Background: In the United States, men who have sex with men (MSM) increasingly represent the majority of people living with and acquiring human immunodeficiency virus (HIV) infection. Local and federal surveillance programs estimate the number of persons living with an HIV diagnosis, persons living with HIV infection, and new diagnoses. Given the absence of population-based estimates of the number of MSM for US states, metropolitan statistical areas (MSAs), or counties, it is not possible to accurately estimate rates using these indicators at these levels, inhibiting the ability to understand HIV burden and to direct prevention efforts.
Objective: To synthesize recently published estimates of MSM population size with publicly available HIV surveillance data, in order to estimate the prevalence of HIV diagnosis and infection and the rate of new diagnoses, at the national, state, MSA, and county levels.
Methods: The number of MSM living with HIV infection in 2012 (prevalence), living with an HIV diagnosis in 2012 (diagnosed prevalence), and newly diagnosed with HIV infection in 2013 (new diagnosis), at state, MSA, and county levels, were obtained from publicly available data from AIDSVu.org and the US Centers for Disease Control and Prevention. The estimated number of MSM living in every US county was calculated using recently published methodology that utilized data from the National Health and Nutrition Examination Survey and American Community Survey. Estimated county-level MSM counts were aggregated to form MSA- and state-level totals. From this, we estimated HIV prevalence, diagnosed prevalence, and new diagnosis rates.
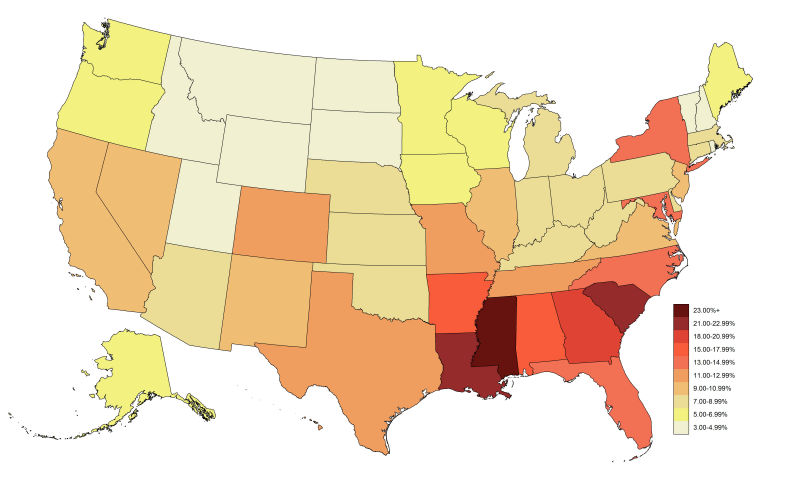
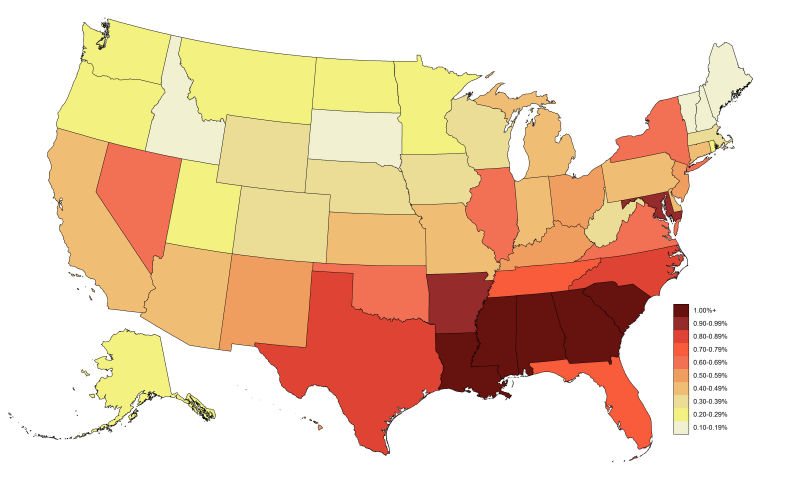
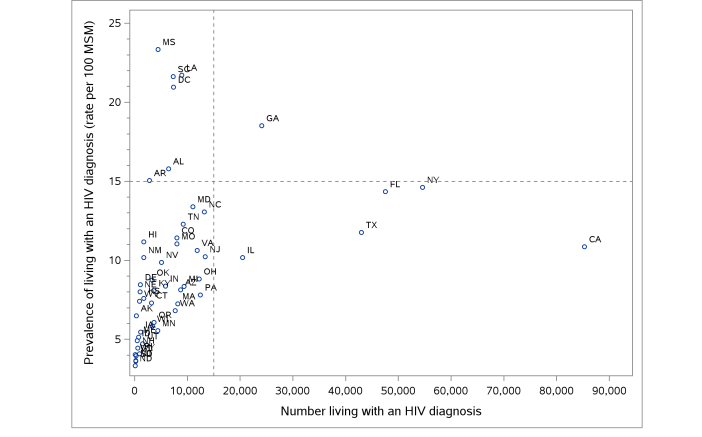
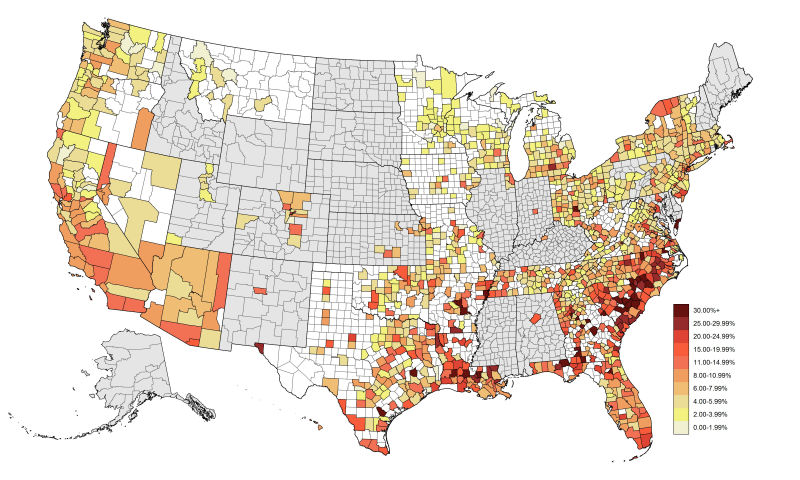
Results: The estimated HIV prevalence among MSM in the United States in 2012 was 15.0% (666,900/4,452,772), the diagnosed HIV prevalence in 2012 was 11.1% (493,453/4,452,772), and the new diagnosis rate for 2013 was 0.7 per 100 MSM. For diagnosed prevalence at the state level, 6 states had both <15,000 cases and diagnosed prevalence rates of ≥15%, all in the South. Five highly populated states had ≥15,000 cases and rates between 10% and 15%. Georgia was the only state with ≥15,000 cases and ≥15% diagnosed prevalence rate. Of the 25 MSAs with the highest diagnosed prevalence rates in the United States, 21 were in the South and 6 had diagnosed prevalence of ≥25%. County-level data showed high diagnosed prevalence rates in both urban and rural counties of the South.
Conclusions: HIV infection is hyperendemic among MSM in many areas of the United States, particularly in the South. Our data emphasize the priorities for HIV prevention and care set forth in the United States National HIV/AIDS Strategy (NHAS) and provide updatable local estimates of NHAS indicators. Jurisdictions can use these results to direct resources, programs, and policies to optimally benefit the health of MSM.
Keywords: HIV diagnosis; HIV incidence; HIV prevalence; HIV surveillance; demography; gay and bisexual men; men who have sex with men.
Conflict of interest statement
Conflicts of Interest: THS and PSS are editors at JMIR Public Health and Surveillance. Because of this, the paper was handled by another academic editor and THS and PSS played no role in assigning reviewers or making editorial decisions.
Figures
Comment in
-
Shining a Light on America's HIV Epidemic among Men who Have Sex with Men.JMIR Public Health Surveill. 2016 May 17;2(1):e25. doi: 10.2196/publichealth.5864. JMIR Public Health Surveill. 2016. PMID: 27244772 Free PMC article. No abstract available.
-
The Importance of Population Denominators for High-Impact Public Health for Marginalized Populations.JMIR Public Health Surveill. 2016 May 17;2(1):e26. doi: 10.2196/publichealth.5883. JMIR Public Health Surveill. 2016. PMID: 27244773 Free PMC article. No abstract available.
References
-
- Centers for Disease Control and Prevention HIV Surveillance Reports. [2016-02-01]. Diagnoses of HIV Infection in the United States and Dependent Areas, 2014 http://www.cdc.gov/hiv/library/reports/surveillance/
-
- Purcell DW, Johnson CH, Lansky A, Prejean J, Stein R, Denning P, Gau Z, Weinstock H, Su J, Crepaz N. Estimating the population size of men who have sex with men in the United States to obtain HIV and syphilis rates. Open AIDS J. 2012;6:98–107. doi: 10.2174/1874613601206010098. http://europepmc.org/abstract/MED/23049658 TOAIDJ-6-98 - DOI - PMC - PubMed
-
- Prejean J, Song R, Hernandez A, Ziebell R, Green T, Walker F, Lin LS, An Q, Mermin J, Lansky A, Hall HI, HIV Incidence Surveillance Group Estimated HIV incidence in the United States, 2006-2009. PLoS One. 2011;6(8):e17502. doi: 10.1371/journal.pone.0017502. http://dx.plos.org/10.1371/journal.pone.0017502 PONE-D-10-02530 - DOI - PMC - PubMed
-
- Centers for Disease Control and Prevention. 2012. [2016-02-23]. Estimated HIV incidence in the United States, 2007-2010; HIV Surveillance Supplemental Report http://www.cdc.gov/hiv/pdf/statistics_hssr_vol_17_no_4.pdf .
-
- Centers for Disease Control and Prevention. 2015. [2016-02-23]. Diagnosed HIV infection among adults and adolescents in metropolitan statistical areas. United States and Puerto Rico, 2013; HIV Surveillance Supplemental Report http://www.cdc.gov/hiv/pdf/library/reports/surveillance/cdc-hiv-surveill... .
Grants and funding
LinkOut - more resources
Full Text Sources
Other Literature Sources
