

Late stage definitive endodermal differentiation can be defined by Daf1 expression
- PMID: 27245320
- PMCID: PMC4888667
- DOI: 10.1186/s12861-016-0120-2
Late stage definitive endodermal differentiation can be defined by Daf1 expression
Abstract
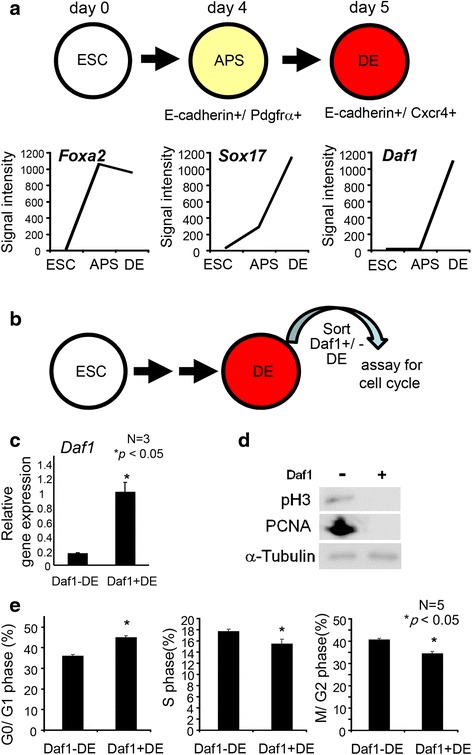
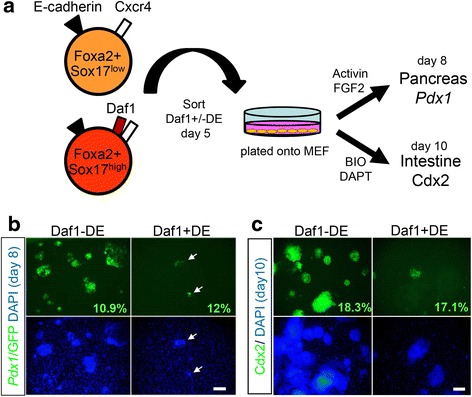
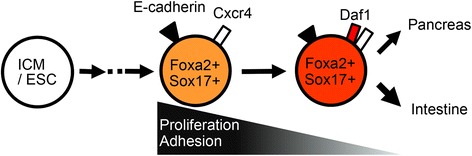
Background: Definitive endoderm (DE) gives rise to the respiratory apparatus and digestive tract. Sox17 and Cxcr4 are useful markers of the DE. Previously, we identified a novel DE marker, Decay accelerating factor 1(Daf1/CD55), by identifying DE specific genes from the expression profile of DE derived from mouse embryonic stem cells (ESCs) by microarray analysis, and in situ hybridization of early embryos. Daf1 is expressed in a subpopulation of E-cadherin + Cxcr4+ DE cells. The characteristics of the Daf1-expressing cells during DE differentiation has not been examined.
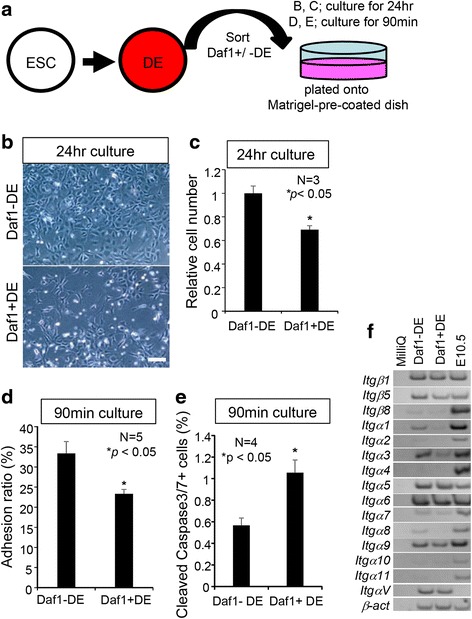
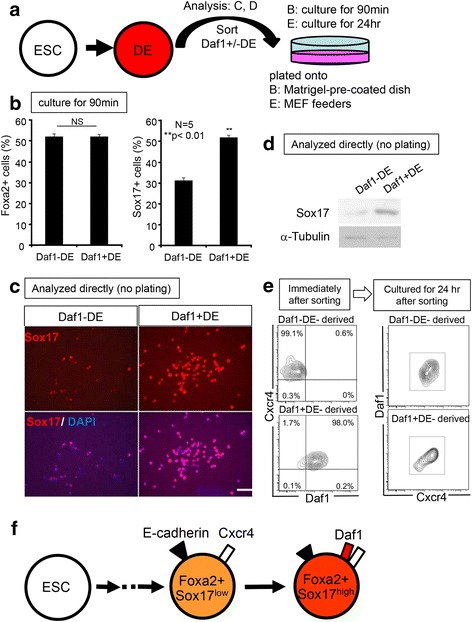
Results: In this report, we utilized the ESC differentiation system to examine the characteristics of Daf1-expressing DE cells. We found that Daf1 expression could discriminate late DE from early DE. Early DE cells are Daf1-negative (DE-) and late DE cells are Daf1-positive (DE+). We also found that Daf1+ late DE cells show low proliferative and low cell matrix adhesive characteristics. Furthermore, the purified SOX17(low) early DE cells gave rise to Daf1+ Sox17(high) late DE cells.
Conclusion: Daf1-expressing late definitive endoderm proliferates slowly and show low adhesive capacity.
Keywords: Adhesion; Daf1; Definitive endoderm; In vitro differentiation; Pluripotent stem cell; Proliferation.
Figures
Similar articles
-
Identification of DAF1/CD55, a novel definitive endoderm marker.Cell Struct Funct. 2010;35(2):73-80. doi: 10.1247/csf.10004. Epub 2010 Jun 4. Cell Struct Funct. 2010. PMID: 20526042
-
Efficient definitive endoderm induction from mouse embryonic stem cell adherent cultures: a rapid screening model for differentiation studies.Stem Cell Res. 2014 Jan;12(1):166-77. doi: 10.1016/j.scr.2013.10.004. Epub 2013 Oct 23. Stem Cell Res. 2014. PMID: 24239964
-
Sox17 plays a substantial role in late-stage differentiation of the extraembryonic endoderm in vitro.J Cell Sci. 2007 Nov 1;120(Pt 21):3859-69. doi: 10.1242/jcs.007856. Epub 2007 Oct 16. J Cell Sci. 2007. PMID: 17940068
-
Signaling pathways during maintenance and definitive endoderm differentiation of embryonic stem cells.Int J Dev Biol. 2013;57(1):1-12. doi: 10.1387/ijdb.120115ls. Int J Dev Biol. 2013. PMID: 23585347 Review.
-
Human parthenogenetic stem cells produce enriched populations of definitive endoderm cells after trichostatin A pretreatment.Differentiation. 2011 Jun;81(5):292-8. doi: 10.1016/j.diff.2011.01.002. Epub 2011 Feb 8. Differentiation. 2011. PMID: 21306817 Review.
Cited by
-
Defining Lineage-Specific Membrane Fluidity Signatures that Regulate Adhesion Kinetics.Stem Cell Reports. 2018 Oct 9;11(4):852-860. doi: 10.1016/j.stemcr.2018.08.010. Epub 2018 Sep 6. Stem Cell Reports. 2018. PMID: 30197117 Free PMC article.
-
Different murine-derived feeder cells alter the definitive endoderm differentiation of human induced pluripotent stem cells.PLoS One. 2018 Jul 26;13(7):e0201239. doi: 10.1371/journal.pone.0201239. eCollection 2018. PLoS One. 2018. PMID: 30048506 Free PMC article.
References
-
- Ang SL, Wierda A, Wong D, Stevens KA, Cascio S, Rossant J, Zaret KS. The formation and maintenance of the definitive endoderm lineage in the mouse: involvement of HNF3/forkhead proteins. Development. 1993;119(4):1301–1315. - PubMed
-
- Lawson KA, Pedersen RA. Cell fate, morphogenetic movement and population kinetics of embryonic endoderm at the time of germ layer formation in the mouse. Development. 1987;101(3):627–652. - PubMed
-
- Loh KM, Ang LT, Zhang J, Kumar V, Ang J, Auyeong JQ, Lee KL, Choo SH, Lim CY, Nichane M, et al. Efficient endoderm induction from human pluripotent stem cells by logically directing signals controlling lineage bifurcations. Cell Stem Cell. 2014;14(2):237–252. doi: 10.1016/j.stem.2013.12.007. - DOI - PMC - PubMed
-
- Nakanishi M, Kurisaki A, Hayashi Y, Warashina M, Ishiura S, Kusuda-Furue M, Asashima M. Directed induction of anterior and posterior primitive streak by Wnt from embryonic stem cells cultured in a chemically defined serum-free medium. FASEB J. 2009;23(1):114–122. doi: 10.1096/fj.08-111203. - DOI - PubMed
Publication types
MeSH terms
Substances
LinkOut - more resources
Full Text Sources
Other Literature Sources
Miscellaneous
