. 2016 May 31:17:416.
doi: 10.1186/s12864-016-2660-z.

Combined physiological, transcriptome, and cis-regulatory element analyses indicate that key aspects of ripening, metabolism, and transcriptional program in grapes (Vitis vinifera L.) are differentially modulated accordingly to fruit size

Affiliations

Combined physiological, transcriptome, and cis-regulatory element analyses indicate that key aspects of ripening, metabolism, and transcriptional program in grapes (Vitis vinifera L.) are differentially modulated accordingly to fruit size

D C J Wong et al. BMC Genomics. .

Abstract

Background: In wine grape production, management practices have been adopted to optimize grape and wine quality attributes by producing, or screening for, berries of smaller size. Fruit size and composition are influenced by numerous factors that include both internal (e.g. berry hormone metabolism) and external (e.g. environment and cultural practices) factors. Combined physiological, biochemical, and transcriptome analyses were performed to improve our current understanding of metabolic and transcriptional pathways related to berry ripening and composition in berries of different sizes.

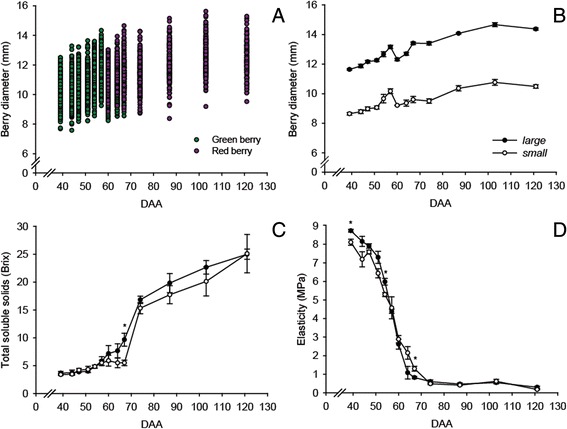
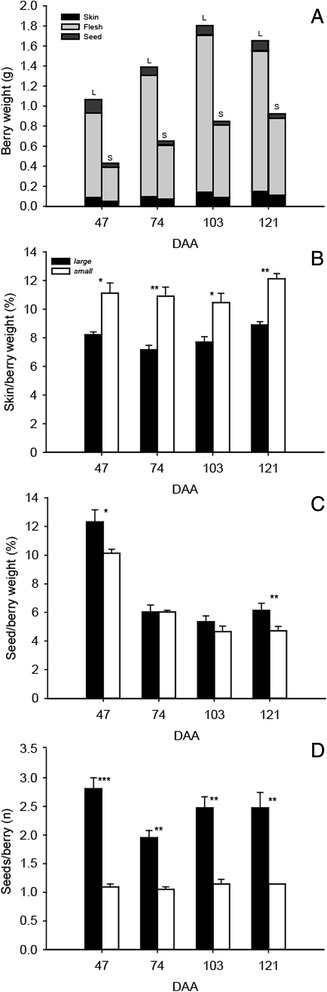
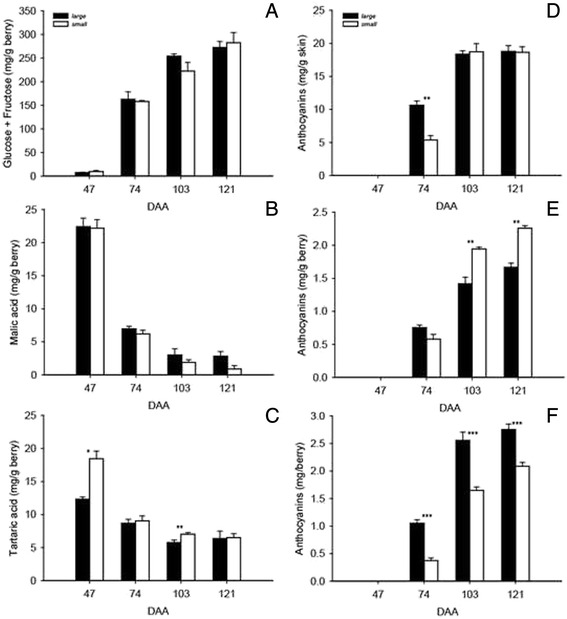
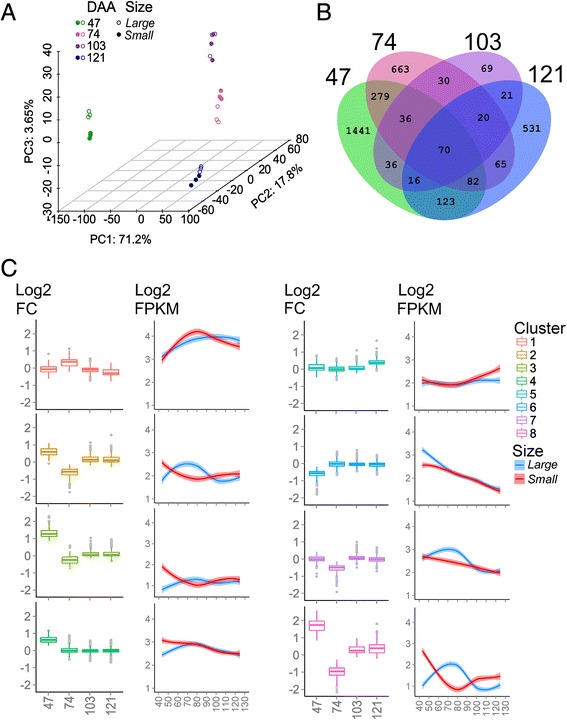
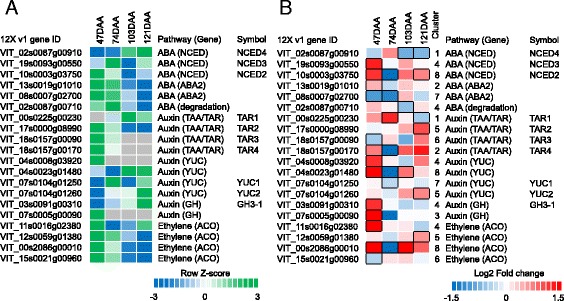
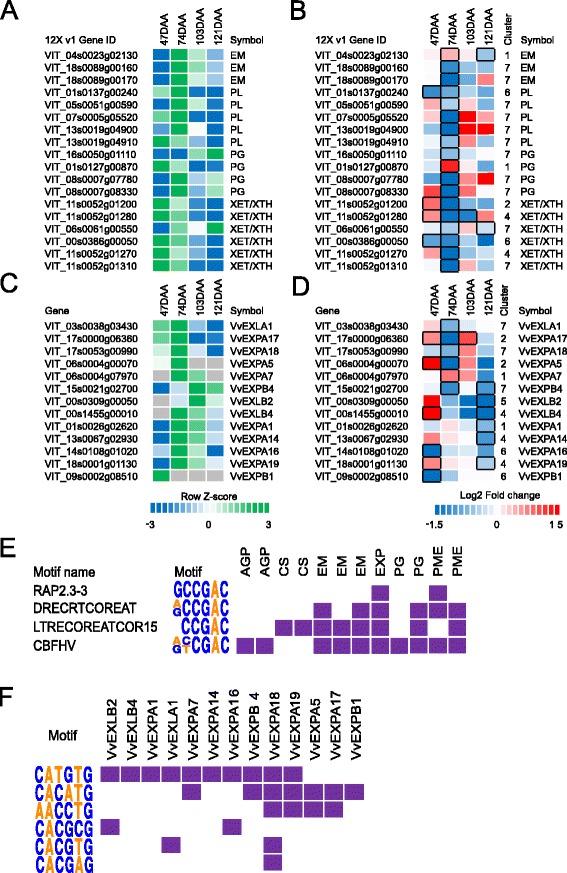
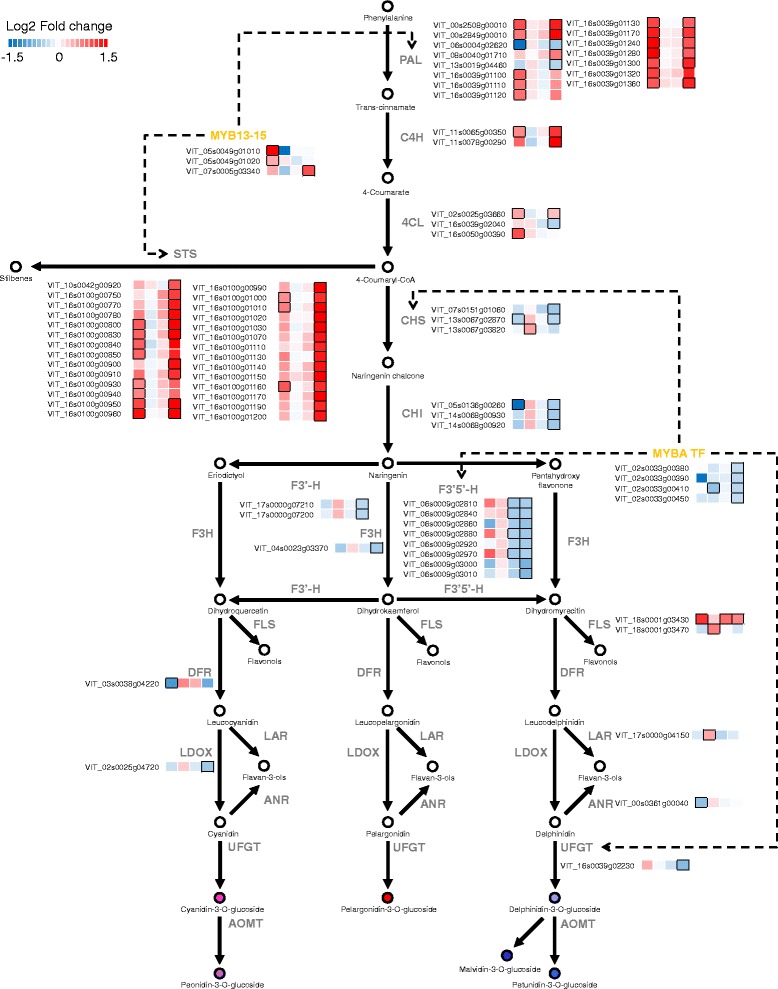
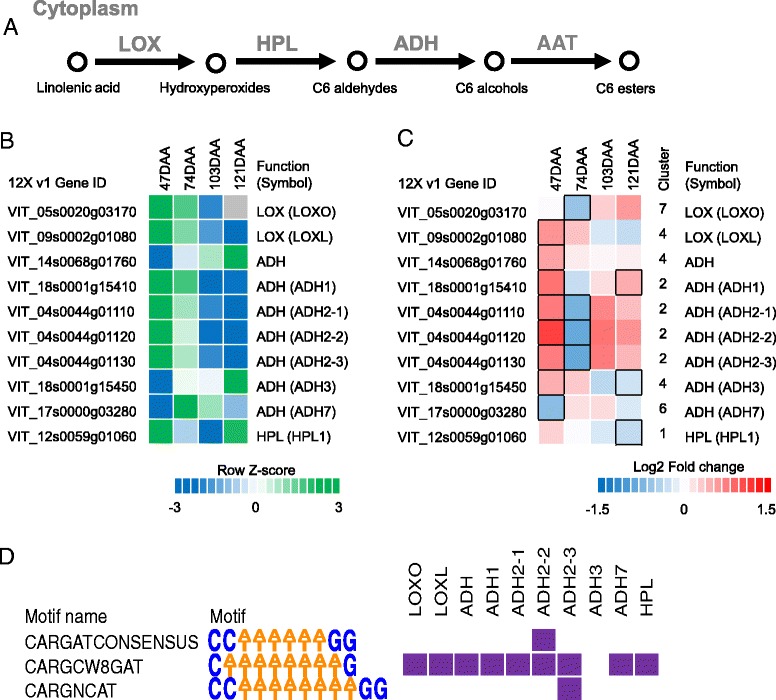
Results: The comparison of berry physiology between small and large berries throughout development (from 31 to 121 days after anthesis, DAA) revealed significant differences in firmness, the rate of softening, and sugar accumulation at specific developmental stages. Small berries had significantly higher skin to berry weight ratio, lower number of seeds per berry, and higher anthocyanin concentration compared to large berries. RNA-sequencing analyses of berry skins at 47, 74, 103, and 121 DAA revealed a total of 3482 differentially expressed genes between small and large berries. Abscisic acid, auxin, and ethylene hormone pathway genes were differentially modulated between berry sizes. Fatty acid degradation and stilbenoid pathway genes were upregulated at 47 DAA while cell wall degrading and modification genes were downregulated at 74 DAA in small compared to large berries. In the late ripening stage, concerted upregulation of the general phenylpropanoid and stilbenoid pathway genes and downregulation of flavonoid pathway genes were observed in skins of small compared to large berries. Cis-regulatory element analysis of differentially expressed hormone, fruit texture, flavor, and aroma genes revealed an enrichment of specific regulatory motifs related to bZIP, bHLH, AP2/ERF, NAC, MYB, and MADS-box transcription factors.

Conclusions: The study demonstrates that physiological and compositional differences between berries of different sizes parallel transcriptome changes that involve fruit texture, flavor, and aroma pathways. These results suggest that, in addition to direct effects brought about by differences in size, key aspects involved in the regulation of ripening likely contribute to different quality profiles between small and large berries.

Keywords: Aroma; Cell wall; Flavonoid; Grapevine; Hormone; Promoter; Quality; RNA-seq; Secondary metabolism; Transcriptomics.


Figures

Fig. 1
Fig. 1
Evolution of berry diameter, total soluble solids, and elasticity. (a) Berry diameter of the entire sampled population. (b) Diameter, (c) total soluble solids, and (d) elasticity of small and large berries during development. Green and purple indicates the recorded color of each individual berry. Means and standard errors are reported for each berry group at each developmental stage. * indicates a significant difference (P < 0.05) between small and large berries
Fig. 2
Fig. 2
Berry features. (a) Skin, flesh, and seed weight, (b) skin to berry weight ratio, (c) seed/berry weight ratio, and (d) seeds/berry number in small and large berries at 47, 74, 103, and 121 DAA. *, **, and *** indicate level of significance of P < 0.05, P < 0.01, and P < 0.001, respectively
Fig. 3
Fig. 3
Berry composition. (a) Glucose + fructose, (b) malic acid, and (c) tartaric acid concentration, expressed as mg/g berry, in small and large berries at 47, 74, 103, and 121 DAA. Anthocyanin levels expressed as (d) mg/g skin, (e) mg/g berry, and (f) mg/berry in small and large berries at 47, 74, 103, and 121 DAA. Means and standard errors are reported for each berry group at each sampling. *, **, and *** indicate level of significance of P < 0.05, P < 0.01, and P < 0.001, respectively
Fig. 4
Fig. 4
Analysis of the berry skin transcriptome of small and large berries. (a) Principal component analysis (PCA) of the berry skin transcriptome of small (filled circles) and large (empty circles) berries at 47 (green), 74 (pink), 103 (purple), and 121 (blue) DAA. (b) The Venn diagram represents the common and unique genes differentially expressed between small and large berries at 47, 74, 103, and 121 DAA. Differentially expressed genes in each intersection of the Venn diagram are described in Additional file 1: Table S3. (c) The box plot and smoothed line plot represents the response of small versus large berries and dynamic change of gene expression during berry development, respectively. Differentially expressed genes were clustered using the k-means algorithm. The log2 fold changes between small and large and log2 (FPKM +1) values at 47, 74, 103, and 121 DAA were used. Outlier log2 fold change values are represented as grey circles
Fig. 5
Fig. 5
Evolution during development and fold change between small and large berries of abscisic acid (ABA), auxin, and ethylene genes differentially expressed at 47, 74, 103, and 121 DAA. (a) Evolution, based on the mean log2 (FPKM + 1) of small and large berries, and (b) log2 fold (small/large) changes. The relative log2 (FPKM + 1) values registered in small and large berries on average during berry development in a are depicted by green (high expression) and blue (low expression). Grey color indicates the absence (or low levels) of detectable transcripts at the corresponding stage. Blue and red colors in b indicate downregulated and upregulated transcripts, respectively, in small berries in relation to large berries. Boxes with bold margins indicate significant differences (adjusted P-value <0.05) between berry size treatments at a given developmental stage. The cluster column in b indicates the cluster number the associated transcript belongs to NCED, 9-cis-epoxycarotenoid dioxygenase; ABA2, xanthoxin dehydrogenase; TAA/TAR, TRYPTOPHAN AMINOTRANSFERASE OF ARABIDOPSIS1/TRYPTOPHAN AMINOTRANSFERASE RELATED (TAA1/TAR); YUC, YUCCA; GH, IAA-amido synthetase; ACO, 1-aminocyclopropane-1-carboxylic acid oxidase
Fig. 6
Fig. 6
Evolution during development, fold change values between small and large berries, and selected cis-regulatory element profile of cell wall transcripts differentially expressed at 47, 74, 103, and 121 DAA. The heat map represents the evolution (a and c), based on the mean log2 (FPKM + 1) of small and large berries, and log2 fold (small/large) changes (b and d) of cell wall degradation (a and b) and modification (c and d) genes. The relative log2 (FPKM + 1) values registered in small and large berries on average during berry development in a and c are depicted by green (high expression) and blue (low expression). Grey color indicates the absence (or low levels) of detectable transcripts at the corresponding stage. Blue and red boxes in b and d indicate downregulated and upregulated transcripts, respectively, in small berries in relation to large berries. Boxes with bold margins indicate significant differences (adjusted P-value <0.05) between small and large berries at a given developmental stage. The cluster column in b and d indicates the cluster number the associated transcript belongs to. EM, 1,4-beta-mannan endohydrolase; PL pectate lyase; PG Polygalacturonase; XET/XTH Xyloglucan endotransglucosylase/hydrolase. (e and f) The heat map illustrates the presence of AP2/ERF and bHLH/NAC cis regulatory elements in cell wall genes. Purple and white colors depict the presence and absence of the respective CRE in the promoter regions of the gene
Fig. 7
Fig. 7
Modulation in berry skin transcripts involved in the phenylpropanoid and flavonoid pathway in small and large berries at 47, 74, 103, and 121 DAA. Blue and red boxes indicate downregulated and upregulated transcripts, respectively, in small berries in relation to large berries. Boxes with bold margins indicate significant differences (adjusted P-value <0.05) between berry size treatments at a given developmental stage. Transcription factors (colored in yellow) involved in the regulation of the phenylpropanoid and/or the flavonoid pathway transcripts are depicted in dotted lines. PAL Phenylalanine lyase; C4H Cinnamate-4-hydroxylase; 4CL 4-Coumarate:coenzyme A ligase; CHI Chalcone isomerase; CHS Chalcone synthase; F3H Flavanone 3-hydroxylase; F3′H Flavonoid 3′-hydroxylase; F3′5′H Flavonoid 3′5′-hydroxylase; FLS flavonol synthase; DFR Dihydroflavonol 4-reductase; LAR Leucoanthocyanin reductase; LDOX Leucoanthocyanin dioxygenase; UFGT UDPglucose:flavonoid 3-O-glucosyltransferase; and AOMT Anthocyanin O-methyltransferase. All other information is available at Additional file 1: Table S5
Fig. 8
Fig. 8
Berry skin transcript and selected cis-regulatory element profile of small and large berries of the fatty acid degradation/C6 volatile biosynthesis pathway at 47, 74, 103, and 121 DAA. (a) Simplified pathway schematic. The heat map represents the transcript evolution (b), based on the mean log2 (FPKM + 1) in small and large berries, and log2 fold (small/large) changes (c). The relative log2 (FPKM + 1) values from the four time points in b are depicted by green (high expression) and blue (low expression). Grey color indicates the absence (or low levels) of detectable transcripts at the corresponding stage. Blue and red boxes in c indicate downregulated and upregulated transcripts, respectively, in small berries in relation to large berries. Boxes with bold margins indicate significant differences (adjusted P-value <0.05) between small and large berries at a given developmental stage. The cluster column in c indicates the cluster the associated transcript belongs to. (d) The heat map illustrates the distribution of MADS box CREs in promoter regions of aroma-related transcripts differentially expressed between small and large berries. Purple and white colors depict the presence and absence of each CREs, respectively, in the promoter regions of the relevant transcripts. LOX Lipoxygenase; HPL Hydroperoxide lyase; ADH Alcohol dehydrogenase; AAT Alcohol acyl transferases

References

    1. Lund ST, Bohlmann J. The molecular basis for wine grape quality–a volatile subject. Science. 2006;311:804–5. doi: 10.1126/science.1118962. - DOI - PubMed
    1. Singleton VL. Effects on red wine quality of removing juice before fermentation to simulate variation in berry size. Am J Enol Vitic. 1972;23:106–13.
    1. Matthews MA, Anderson MM. Fruit ripening in Vitis vinifera L.: responses to seasonal water deficits. Am J Enol Vitic. 1988;39:313–20.
    1. Coombe BG. Research on development and ripening of the grape berry. Am J Enol Vitic. 1992;43:101–10.
    1. Kuhn N, Guan L, Dai ZW, Wu BH, Lauvergeat V, Gomès E, Li SH, Godoy F, Arce-Johnson P, Delrot S. Berry ripening: recently heard through the grapevine. J Exp Bot. 2014;65:4543–59. - PubMed

Publication types

Substances

LinkOut - more resources