. 2016 Jul;171(3):1720-33.
doi: 10.1104/pp.16.00420. Epub 2016 May 31.

The ROS Wheel: Refining ROS Transcriptional Footprints

Affiliations

The ROS Wheel: Refining ROS Transcriptional Footprints

Patrick Willems et al. Plant Physiol. 2016 Jul.

Abstract

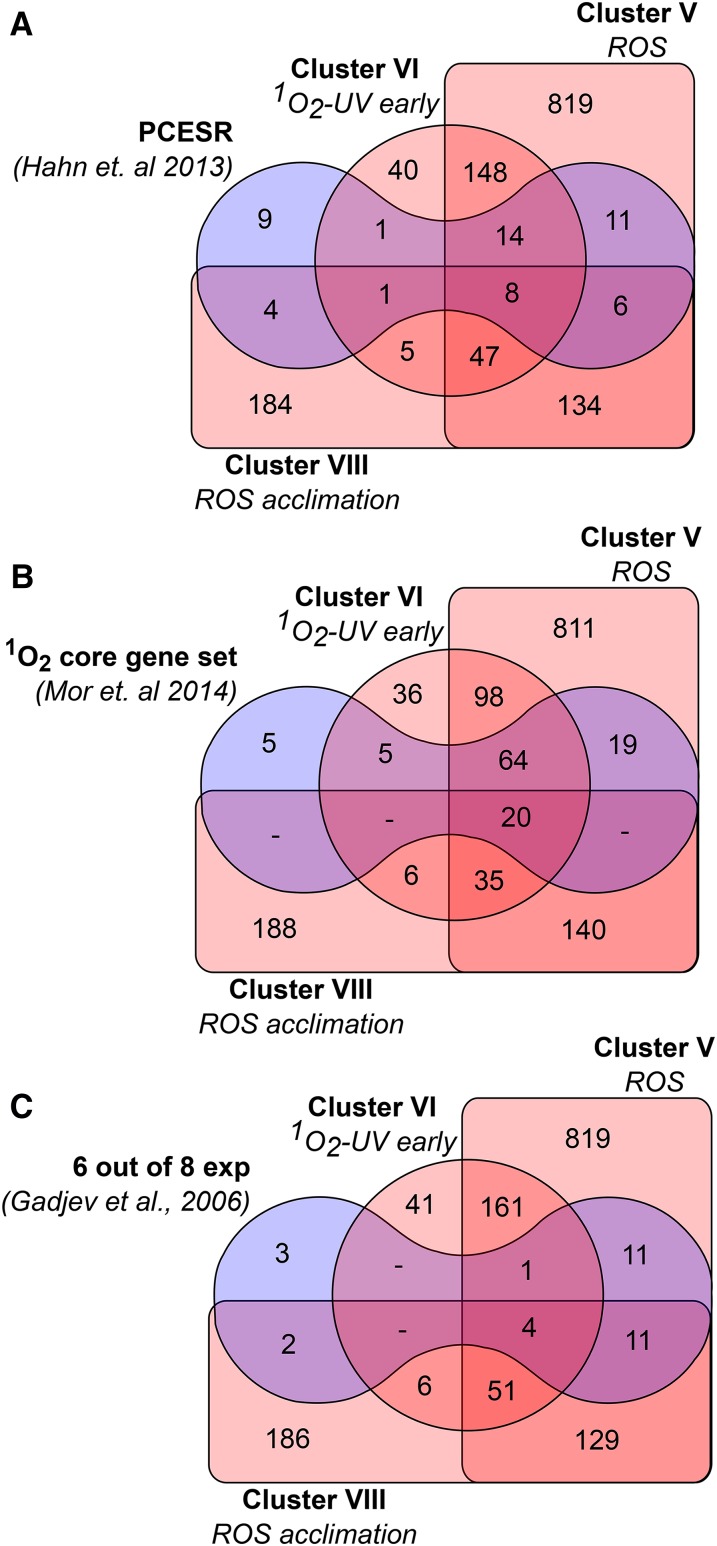
In the last decade, microarray studies have delivered extensive inventories of transcriptome-wide changes in messenger RNA levels provoked by various types of oxidative stress in Arabidopsis (Arabidopsis thaliana). Previous cross-study comparisons indicated how different types of reactive oxygen species (ROS) and their subcellular accumulation sites are able to reshape the transcriptome in specific manners. However, these analyses often employed simplistic statistical frameworks that are not compatible with large-scale analyses. Here, we reanalyzed a total of 79 Affymetrix ATH1 microarray studies of redox homeostasis perturbation experiments. To create hierarchy in such a high number of transcriptomic data sets, all transcriptional profiles were clustered on the overlap extent of their differentially expressed transcripts. Subsequently, meta-analysis determined a single magnitude of differential expression across studies and identified common transcriptional footprints per cluster. The resulting transcriptional footprints revealed the regulation of various metabolic pathways and gene families. The RESPIRATORY BURST OXIDASE HOMOLOG F-mediated respiratory burst had a major impact and was a converging point among several studies. Conversely, the timing of the oxidative stress response was a determining factor in shaping different transcriptome footprints. Our study emphasizes the need to interpret transcriptomic data sets in a systematic context, where initial, specific stress triggers can converge to common, aspecific transcriptional changes. We believe that these refined transcriptional footprints provide a valuable resource for assessing the involvement of ROS in biological processes in plants.


Figures

Figure 1.
Figure 1.
ROS transcriptional profiles and perturbation categories. Transcriptional profiles monitoring ROS homeostasis perturbations were classified under 12 categories (boldface text). For each perturbation category, the number of transcriptional profiles is given. These profiles monitor the transcriptional changes of chemical treatments, environmental stresses, and/or genetic backgrounds. cyt b6f, Cytochrome b6f; DMBIB, 2,5-dibromo-6-isopropyl-3-methyl-1,4-benzoquinone; FLS2, FLAGELLIN SENSITIVE2; NO, nitric oxide; PNO8, N-octyl-3-nitro-2,4,6-trihydroxybenzamide; SOD, superoxide dismutase; VIS, visible.
Figure 2.
Figure 2.
The ROS wheel. All 157 transcriptional profiles were hierarchically clustered according their DEG overlap (see “Materials and Methods”). The hierarchical tree was cut at a fixed height of 0.8 (Supplemental Fig. S1), and clusters that contained at least five profiles, originating from a minimum of two independent studies, are highlighted (clusters I–VIII; thick edges). The numbering of studies is specified in parentheses if a study contained multiple transcriptional profiles. Each profile is accompanied by a circle color coded according to its perturbation category (Supplemental Table S1). CC, Cell cultures; PTI, pattern-triggered immunity.
Figure 3.
Figure 3.
DEG overlaps between transcriptional profiles of ROS acclimation cluster VIII. Cluster VIII was extracted from the hierarchical clustering tree (Supplemental Fig. S1), and the fixed height cutoff is shown (branched line). Node labels specify the DEG overlap between the respective transcriptional profiles or unions thereof (see inset). In total, 12 core DEGs (i.e. differentially expressed in all profiles) were found for cluster VIII (indicated in boldface). Ws, Wassilewskija accession.
Figure 4.
Figure 4.
REMs for GLUTAREDOXIN13 and all genes in cluster VIII. A, REM for GLUTAREDOXIN13 (GRXS13; AT1G03850), showing the log2 FCs with their 95% confidence interval (95% CI) and P values (P > 0.01 in red) for the 12 transcriptional profiles constituting cluster VIII. The differential expression effect size determined by the REM is indicated at the bottom (boldface text). Ws, Wassilewskija accession. B, Transcriptional footprint of cluster VIII. REMs were fitted for all 21,430 genes (GRXS13 indicated in red), and a gene was considered to be significantly more highly expressed when the lower boundary of the confidence interval (CILB) was greater than a log2 FC of 0.58 (FC of 1.5) or less expressed when the upper boundary of the confidence interval (CIUB) was smaller than a log2 FC of −0.58.
Figure 5.
Figure 5.
GSEA of transcriptional footprints. A, Up- or down-regulated genes belonging to the transcriptional footprints of clusters I to VIII (columns) were controlled for enrichment in GO biological process (BP), pathway, and protein family gene sets (rows) using the PlantGSEA tool (Yi et al., 2013; see “Materials and Methods”). Enrichment of gene sets (FDR < 0.05) is colored in red (enriched induced genes) or blue (enriched repressed genes) according to their significance (−log FDR). AP2/EREBP, APETALA2 and ETHYLENE-RESPONSIVE ELEMENT BINDING PROTEIN; CDPK, CALCIUM-DEPENDENT KINASE; HSF, HEAT SHOCK FACTOR. B, Heat map displaying the summarized differential expression of flavonoid biosynthesis-associated genes in clusters I to VIII.
Figure 6.
Figure 6.
Comparison of transcriptional footprints in clusters V, VI, and VII with the previous meta-analysis. DEG intersection gene lists described by Hahn et al. (2013; A), Mor et al. (2014; B), and Gadjev et al. (2006; C) were compared with transcriptional footprints of clusters V, VI, and VIII. Our probe set annotation caused the loss of three of the PCESR and five of the 1O2 core gene sets.
Figure 7.
Figure 7.
Overlap of induced gene transcriptional footprints and RNA-Seq studies. All induced genes (CILB > 0.58) of clusters I to VIII intersected with those from the 15-min flu and 3-h cat2 RNA-Seq studies (FDR < 0.01, log2 FC > 1). The transcriptional footprints (x axis) are colored according to their overlap with both RNA-Seq studies, with induced genes either not overlapping (gray) or induced in the 15-min flu (green), 3-h cat2 (orange), or both RNA-Seq (dark red) studies.

Similar articles

Cited by

References

    1. Albrecht V, Simková K, Carrie C, Delannoy E, Giraud E, Whelan J, Small ID, Apel K, Badger MR, Pogson BJ (2010) The cytoskeleton and the peroxisomal-targeted snowy cotyledon3 protein are required for chloroplast development in Arabidopsis. Plant Cell 22: 3423–3438 - PMC - PubMed
    1. Booker F, Burkey K, Morgan P, Fiscus E, Jones A (2012) Minimal influence of G-protein null mutations on ozone-induced changes in gene expression, foliar injury, gas exchange and peroxidase activity in Arabidopsis thaliana L. Plant Cell Environ 35: 668–681 - PMC - PubMed
    1. Cahan P, Rovegno F, Mooney D, Newman JC, St Laurent G III, McCaffrey TA (2007) Meta-analysis of microarray results: challenges, opportunities, and recommendations for standardization. Gene 401: 12–18 - PMC - PubMed
    1. Chaouch S, Queval G, Noctor G (2012) AtRbohF is a crucial modulator of defence-associated metabolism and a key actor in the interplay between intracellular oxidative stress and pathogenesis responses in Arabidopsis. Plant J 69: 613–627 - PubMed
    1. Chen C, Grennan K, Badner J, Zhang D, Gershon E, Jin L, Liu C (2011) Removing batch effects in analysis of expression microarray data: an evaluation of six batch adjustment methods. PLoS ONE 6: e17238. - PMC - PubMed

Publication types

MeSH terms

Substances