. 2016 May 31;17(1):115.
doi: 10.1186/s13059-016-0971-7.

Single-cell sequencing reveals karyotype heterogeneity in murine and human malignancies

Affiliations

Single-cell sequencing reveals karyotype heterogeneity in murine and human malignancies

Bjorn Bakker et al. Genome Biol. .

Abstract

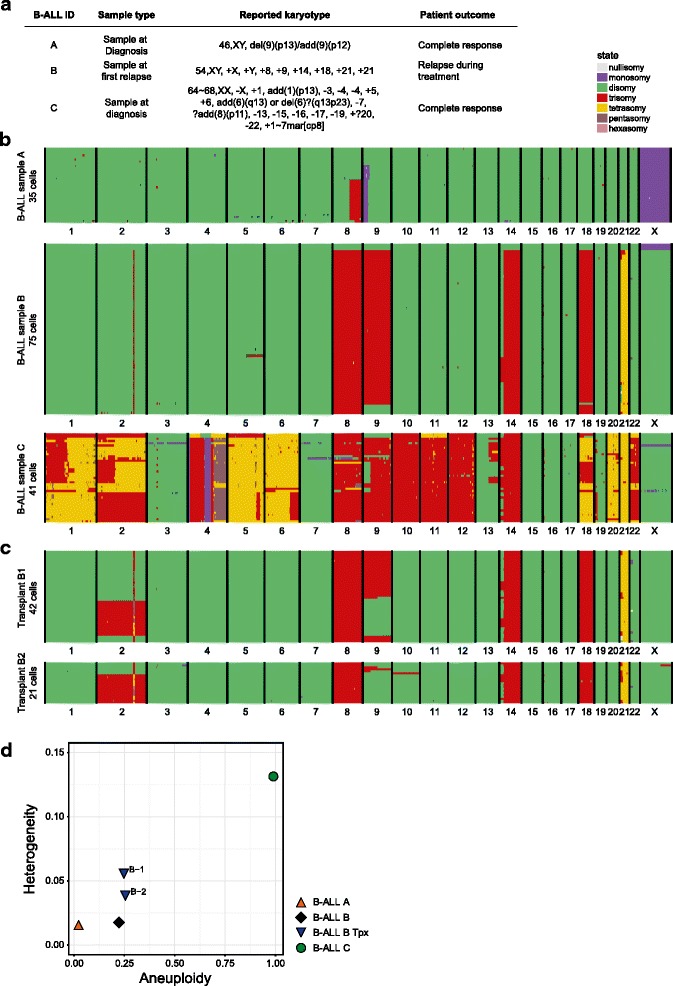
Background: Chromosome instability leads to aneuploidy, a state in which cells have abnormal numbers of chromosomes, and is found in two out of three cancers. In a chromosomal instable p53 deficient mouse model with accelerated lymphomagenesis, we previously observed whole chromosome copy number changes affecting all lymphoma cells. This suggests that chromosome instability is somehow suppressed in the aneuploid lymphomas or that selection for frequently lost/gained chromosomes out-competes the CIN-imposed mis-segregation.

Results: To distinguish between these explanations and to examine karyotype dynamics in chromosome instable lymphoma, we use a newly developed single-cell whole genome sequencing (scWGS) platform that provides a complete and unbiased overview of copy number variations (CNV) in individual cells. To analyse these scWGS data, we develop AneuFinder, which allows annotation of copy number changes in a fully automated fashion and quantification of CNV heterogeneity between cells. Single-cell sequencing and AneuFinder analysis reveals high levels of copy number heterogeneity in chromosome instability-driven murine T-cell lymphoma samples, indicating ongoing chromosome instability. Application of this technology to human B cell leukaemias reveals different levels of karyotype heterogeneity in these cancers.

Conclusion: Our data show that even though aneuploid tumours select for particular and recurring chromosome combinations, single-cell analysis using AneuFinder reveals copy number heterogeneity. This suggests ongoing chromosome instability that other platforms fail to detect. As chromosome instability might drive tumour evolution, karyotype analysis using single-cell sequencing technology could become an essential tool for cancer treatment stratification.

Keywords: Aneuploidy; Copy number detection; Karyotype heterogeneity; Leukaemia; Lymphoma; Single-cell sequencing.


Figures

Fig. 1
Fig. 1
Chromosomal instable T-ALL display recurring chromosome copy numbers, as assessed by array CGH. a Two representative T-ALLs analysed using array CGH, compared to a euploid reference, showing recurrent gains of chromosomes 4, 9, 14 and 15, and other tumour-specific alterations. The purple bars indicate the mean log-value of the respective chromosome. b Cumulative single-cell sequencing libraries to simulate bulk data, showing a comparable karyotype as found by aCGH. c Single-cell sequencing analysis of four representative cells from T-ALL 1, showing identical chromosome copy numbers to the aCGH profile (cell 1), or cell-unique copy numbers (cells 2, 3 and 4; red arrows)
Fig. 2
Fig. 2
AneuFinder – automated copy number analysis of single-cell sequencing data. a Samples are homogenised, single-cell sorted and sequenced. b Aligned sequencing reads are counted in non-overlapping bins of variable size based on mappability. c A Hidden Markov Model with multiple hidden states is applied to the binned read counts in order to predict copy number state of every single bin. Emission distributions are modelled as negative binomial distributions (NB (r,p,x)). d The model parameters are estimated using the Baum Welch algorithm and every binned read count is assigned to the copy number state that maximises the posterior probability. e Quality of each single-cell library is assessed based on the following measures: spikiness, loglikelihood of the model determined by the Baum-Welch algorithm, number of separate copy number segments and Bhattacharyya distance. Libraries are clustered based on these measures: the highest scoring cluster is selected for further analysis. f The extent of aneuploidy is measured as the divergence of a given chromosome from the normal euploid state. At the cell population level, heterogeneity is measured as the number of cells with a distinct copy number profile within the population. g Example of a genome-wide copy number profile of a population of T-ALL cells. Each row represents a single cell with chromosomes plotted as columns. Copy number states are depicted in different colours. Cells are clustered based on the similarity of their copy number profile
Fig. 3
Fig. 3
Single-cell sequencing analysis confirms both recurrent chromosome copy numbers and karyotype heterogeneity in CIN T-ALLs. a Kaplan-Meier survival curve of the listed genotypes. T-ALLs that were single-cell sequenced in this study are indicated with a black arrow and tumour ID. b Thymic/T-ALL weights of the listed genotypes. T-ALLs indicated in red were analysed using single-cell sequencing. ch Genome-wide copy number plots as generated by the AneuFinder algorithm for six samples: one Lck-Cre control thymus and five CIN-driven T-ALLs. Individual cells are represented in rows, with the copy number state for ~1 Mb bins indicated in colours (see legend)
Fig. 4
Fig. 4
Early time point T-ALLs show similar levels of karyotype heterogeneity as endpoint lymphomas. a Aneuploidy and heterogeneity scores for the listed samples. The black diamond indicates the ‘baseline’ aneuploidy and heterogeneity based on the Mps1 f/f p53 f/f Lck-Cre control thymus. b Aneuploidy and heterogeneity scores for a control thymus, T260, and T158 plotted per chromosome. Colours of the labels indicate clusters of chromosomes that favour a euploid copy number (green), show random copy number changes (blue) or favour copy number changes (red). c Chromosome counts acquired by metaphase spreads of three independently derived T-ALL cell lines (line 1, n = 35; line 2, n = 48; line 3, n = 30). Bars are median number of chromosomes (49, 47.5 and 51 for lines 1, 2 and 3, respectively). The black dotted line indicates the euploid chromosome count of 40 for mice. d Still frame of a mitotic cell from line 1 (T302) labelled with H2B-GFP, showing a lagging chromosome (white arrowhead). Frame is deconvolved and maximally projected. e Frequency of mitotic errors as analysed using live-cell time-lapse imaging of the H2B-GFP labelled lymphoma cell line 1 (n = 32). f, g Genome-wide copy number plots for G1 (f) cells and G2/near-tetraploid cells (g) for tumour T158. h, i Genome-wide copy number plots for G1 (h) cells and G2/near-tetraploid cells (i) for tumour T257
Fig. 5
Fig. 5
Karyotype heterogeneity of human B-ALLs increases upon engraftment into recipient mice. a Overview of B-ALL patient material used in this study. b Genome-wide copy number plots using ~1 Mb bins for bone marrow cells of three B-ALL patients. For B-ALL A and B, respectively, 8 and 3 euploid cells are present (non-cancer cells). c Genome-wide copy number plots using ~1 Mb bins for bone marrow cells of two mice, 28 weeks after engraftment with B-ALL B. d Aneuploidy and heterogeneity scores for the analysed B-ALL patient material and engraftments B-1 and B-2. The orange triangle indicates the baseline level of aneuploidy and heterogeneity of the near-euploid B-ALL A

References

    1. Williams BR, Prabhu VR, Hunter KE, Glazier CM, Whittaker CA, Housman DE, et al. Aneuploidy affects proliferation and spontaneous immortalization in mammalian cells. Science. 2008;322:703–9. doi: 10.1126/science.1160058. - DOI - PMC - PubMed
    1. Torres EM, Sokolsky T, Tucker CM, Chan LY, Boselli M, Dunham MJ, et al. Effects of aneuploidy on cellular physiology and cell division in haploid yeast. Science. 2007;317:916–24. doi: 10.1126/science.1142210. - DOI - PubMed
    1. Baker DJ, Jeganathan KB, Cameron JD, Thompson M, Juneja S, Kopecka A, et al. BubR1 insufficiency causes early onset of aging-associated phenotypes and infertility in mice. Nat Genet. 2004;36:744–9. doi: 10.1038/ng1382. - DOI - PubMed
    1. Baker DJ, Jeganathan KB, Malureanu L, Perez-Terzic C, Terzic A, van Deursen JM. Early aging-associated phenotypes in Bub3/Rae1 haploinsufficient mice. J Cell Biol. 2006;172:529–40. doi: 10.1083/jcb.200507081. - DOI - PMC - PubMed
    1. Baker DJ, Dawlaty MM, Wijshake T, Jeganathan KB, Malureanu L, van Ree JH, et al. Increased expression of BubR1 protects against aneuploidy and cancer and extends healthy lifespan. Nat Cell Biol. 2013;15:96–102. doi: 10.1038/ncb2643. - DOI - PMC - PubMed

Publication types