. 2016 Aug;6(8):852-69.
doi: 10.1158/2159-8290.CD-15-1177. Epub 2016 May 31.

Obesity-Induced Inflammation and Desmoplasia Promote Pancreatic Cancer Progression and Resistance to Chemotherapy

Affiliations

Obesity-Induced Inflammation and Desmoplasia Promote Pancreatic Cancer Progression and Resistance to Chemotherapy

Joao Incio et al. Cancer Discov. 2016 Aug.

Abstract

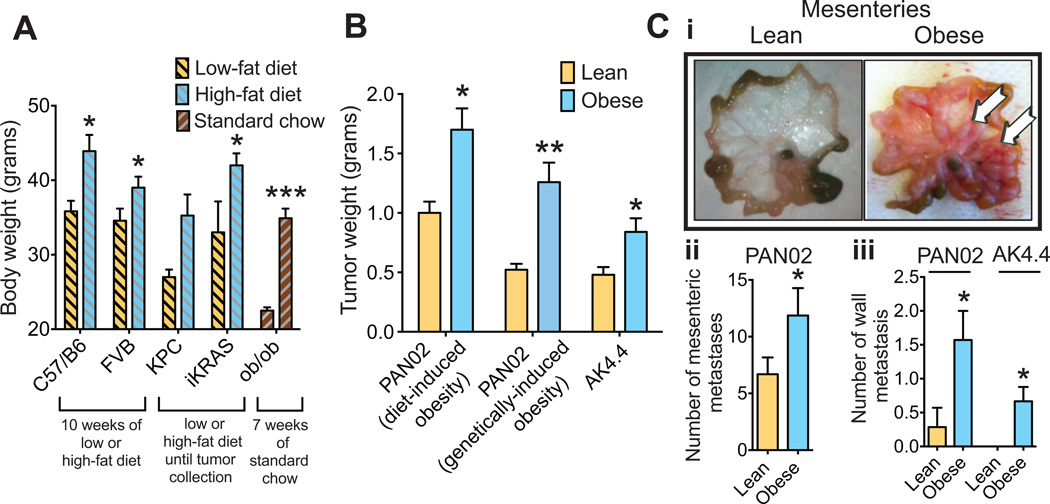
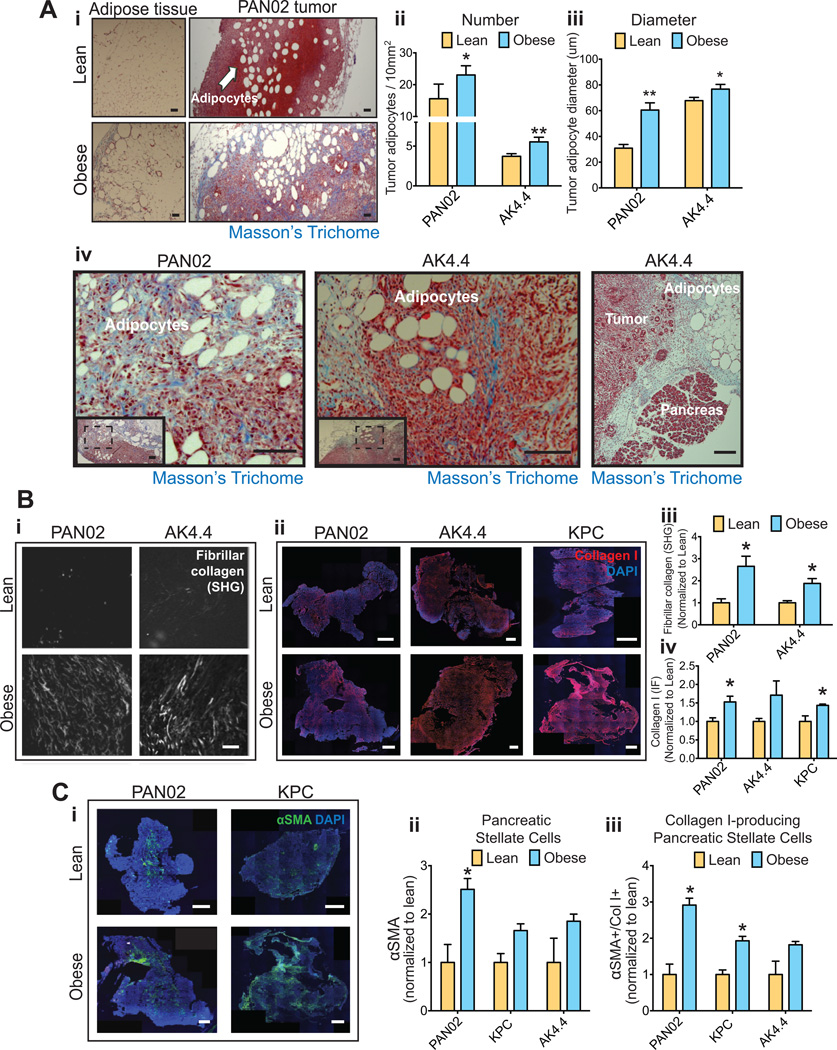
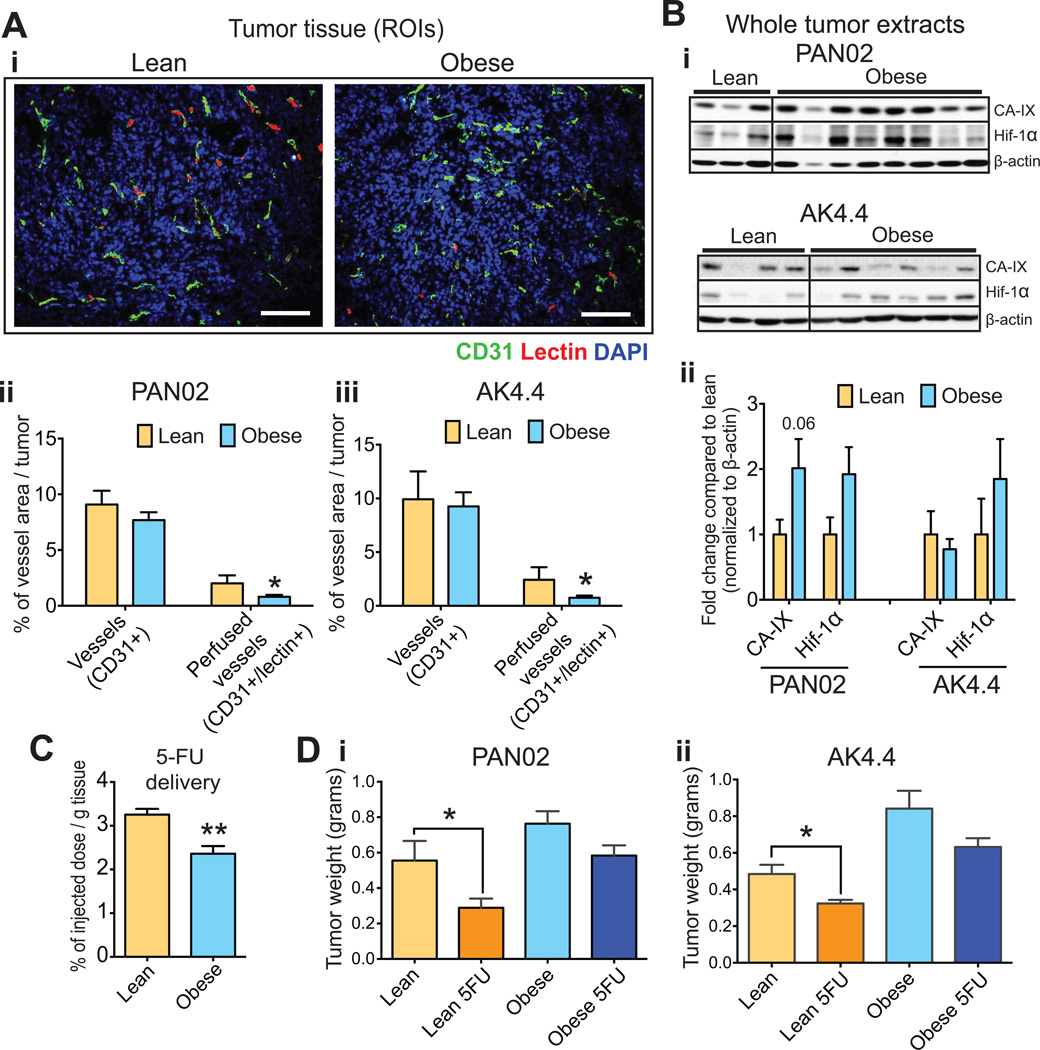
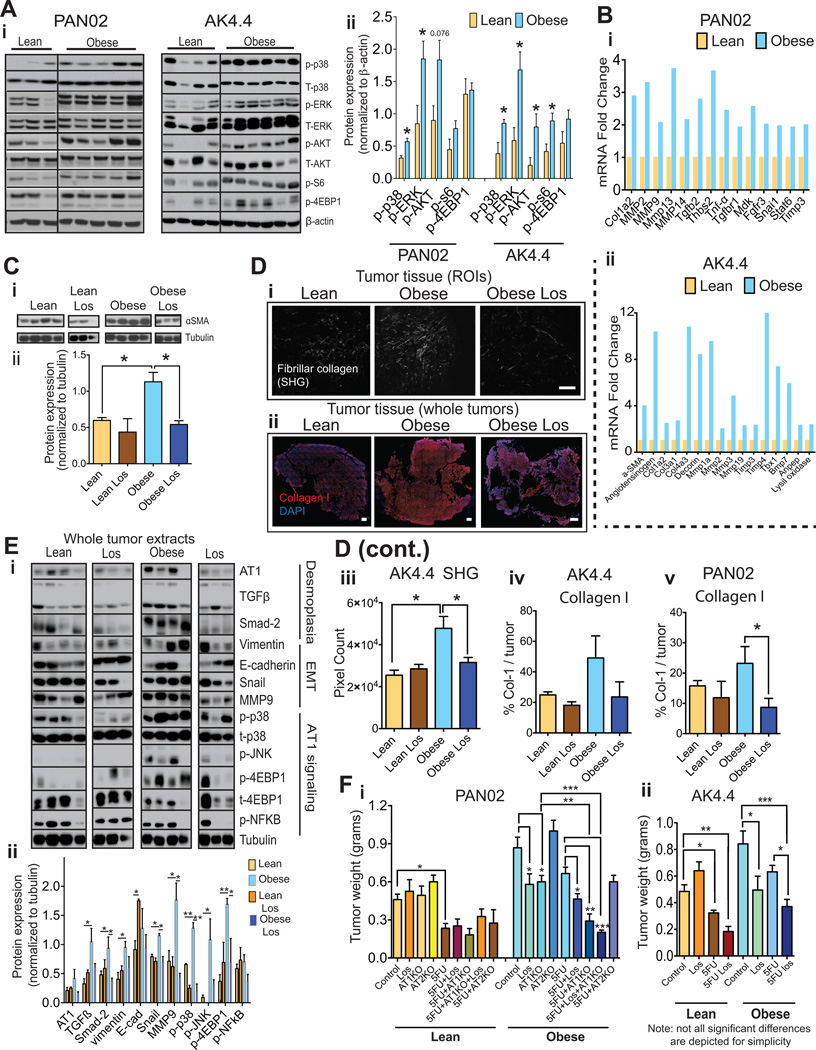
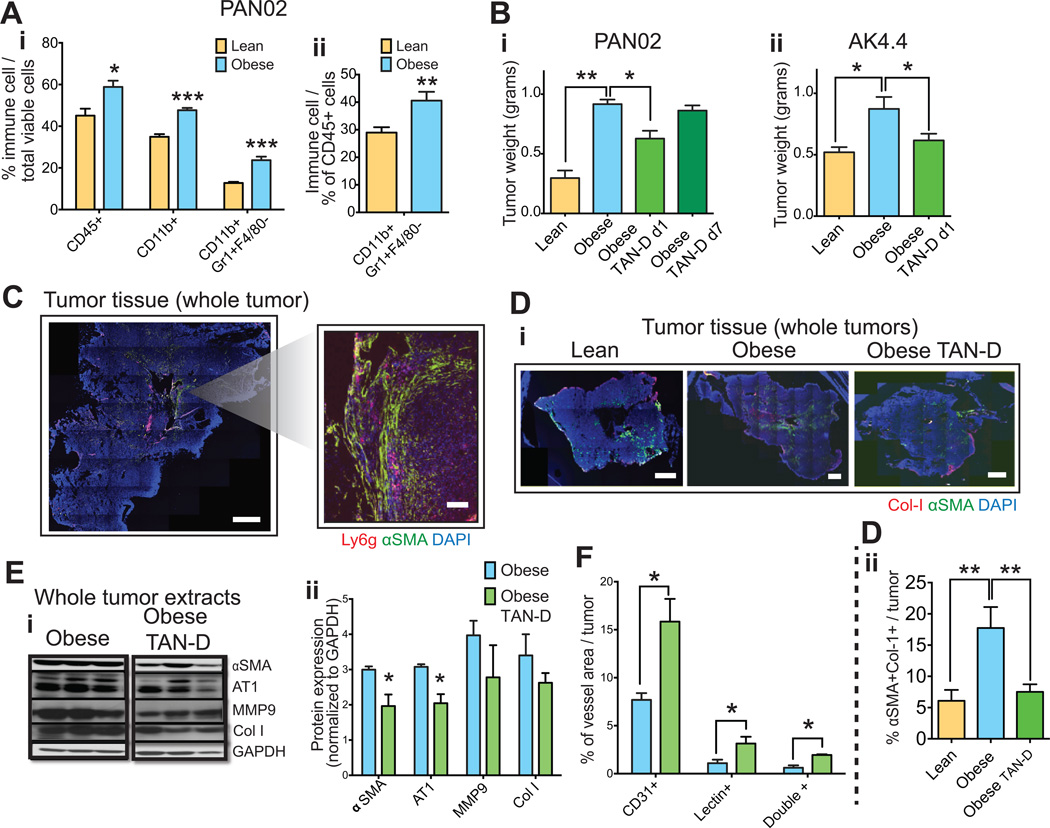
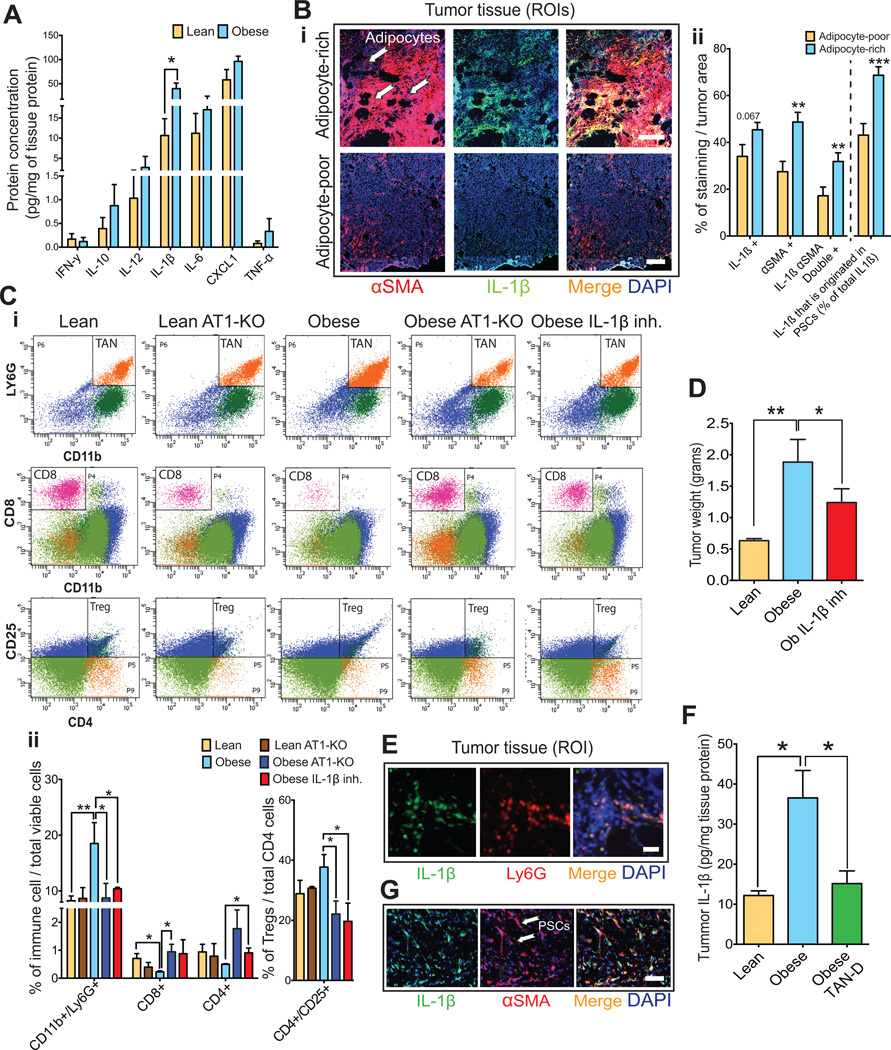
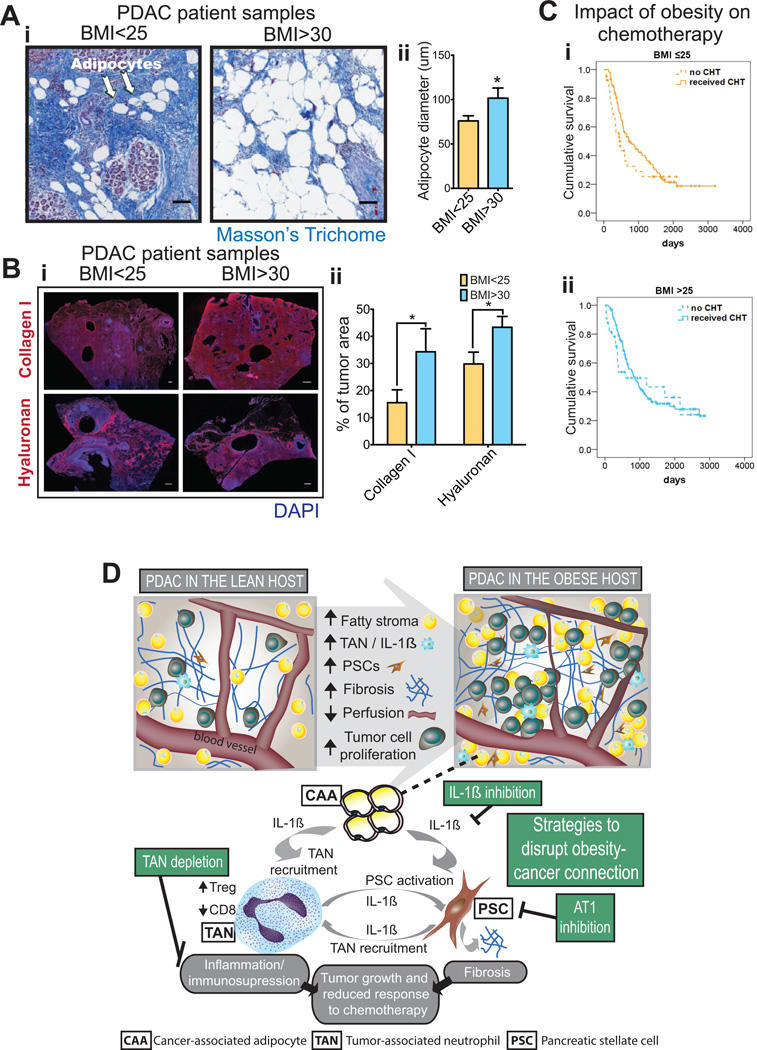
It remains unclear how obesity worsens treatment outcomes in patients with pancreatic ductal adenocarcinoma (PDAC). In normal pancreas, obesity promotes inflammation and fibrosis. We found in mouse models of PDAC that obesity also promotes desmoplasia associated with accelerated tumor growth and impaired delivery/efficacy of chemotherapeutics through reduced perfusion. Genetic and pharmacologic inhibition of angiotensin-II type-1 receptor reverses obesity-augmented desmoplasia and tumor growth and improves response to chemotherapy. Augmented activation of pancreatic stellate cells (PSC) in obesity is induced by tumor-associated neutrophils (TAN) recruited by adipocyte-secreted IL1β. PSCs further secrete IL1β, and inactivation of PSCs reduces IL1β expression and TAN recruitment. Furthermore, depletion of TANs, IL1β inhibition, or inactivation of PSCs prevents obesity-accelerated tumor growth. In patients with pancreatic cancer, we confirmed that obesity is associated with increased desmoplasia and reduced response to chemotherapy. We conclude that cross-talk between adipocytes, TANs, and PSCs exacerbates desmoplasia and promotes tumor progression in obesity.

Significance: Considering the current obesity pandemic, unraveling the mechanisms underlying obesity-induced cancer progression is an urgent need. We found that the aggravation of desmoplasia is a key mechanism of obesity-promoted PDAC progression. Importantly, we discovered that clinically available antifibrotic/inflammatory agents can improve the treatment response of PDAC in obese hosts. Cancer Discov; 6(8); 852-69. ©2016 AACR.See related commentary by Bronte and Tortora, p. 821This article is highlighted in the In This Issue feature, p. 803.


Figures

Figure 1
Figure 1. Obesity promotes tumor initiation and progression
(A) Generation of obese mouse models. High-fat (60%) versus low-fat (10%) diets started at six weeks of age generated a difference in body weight (BW) in multiple models. Data represents the body weight of wild-type C57BL/6 and FVB mice after ten weeks on diet, and of the spontaneous PDAC models (KPC and iKRAS) at the time of tumor collection (between 15–20 weeks of diet for KPC, 12–16 weeks for iKRAS). Body weight of mice genetically deficient for leptin (ob/ob) or age-matched WT mice was recorded after seven weeks on a standard chow (n = 8–10/ group for C57Bl/6, FVB, and ob/ob, 4–10/group for KPC, 7–21/group for iKRAS). (B) Effect of obesity on tumor growth. Data in this panel represent the weight of tumors collected three weeks after implantation. PAN02 and AK4.4 syngeneic tumors were orthotopically implanted in C57BL/6 and FVB mice respectively at ten weeks of diet (diets were continued until tumor collection); ob/ob mice and corresponding age-matched WT mice were implanted with PAN02 tumors at seven weeks of age (mice under standard chow). Obese animals presented with higher tumor weights than lean counterparts in all models (n = 8–10/group). (C) Effect of obesity on metastasis. (C-i): Representative images of mesenteric peritoneal dissemination observed in lean and obese mice three weeks after implantation of PAN02 tumors. (C-ii): Quantification of mesenteric peritoneal metastasis in the PAN02 model (n = 26–30/group). (C-iii): Quantification of retro-peritoneal metastasis in the PAN02 model and AK4.4 model (n = 4–7/group). Data are shown as mean ± standard error of the mean (SEM). P values were determined by the Student t-test. *, P < 0.05; **, P < 0.01; ***, P < 0.001.
Figure 2
Figure 2. Obesity aggravates tumor desmoplasia
(A) Description of the adipose microenvironment in tumors from obese mice. (A-i) Adipocyte enlargement and fibrosis in visceral adipose tissue and tumors from obese mice. Masson’s Trichrome staining denotes fibrosis in blue. Arrows: Adipocytes. Scale bars: 200 µm. Adipocyte count (A-ii) and size (A-iii) in PAN02 and AK4.4 tumors, indicating an enrichment for enlarged adipocytes in the tumor microenvironment in obese mice (n=3 tumors/group, 8 ROIs/tumor). (A-iv) Representative images of the adipose tissue-tumor interaction, revealing increased expression of fibrosis where tumors invade the adjacent adipose tissue. On the far right, tumor epithelium is observed in close proximity to fibrotic adipose tissue and normal pancreas. Tumor sections were stained for Masson’s Trichrome. Scale bars: 100 µm (PAN02), 200 µm (AK4.4), 500 µm (Ak4.4 far right). (B) Collagen levels in PDACs. (B-i) Representative pictures of fibrillar collagen in tumors using second harmonic generation (SHG). Scale bars: 100 µm. (B-ii) Representative pictures of collagen I staining (immunofluorescence) in tumors. Scale bars: 1 mm. (B-iii) Quantification of fibrillar collagen normalized to lean animals. Tumors from obese mice presented with increased expression of fibrillar collagen in PAN02 and AK4.4 orthotopic PDACs. (B-iv) Quantification of collagen expression normalized to lean animals. Tumors from obese mice presented with increased collagen I expression in three different tumor models (n=3–6/group). (C) Effect of obesity on αSMA expression in PDACs. (C-i) Representative pictures of αSMA expression in AK4.4, PAN02 and KPC tumors by immunofluorescence. (C-ii) Quantification of αSMA expression by immunofluorescence was performed as a % of αSMA (C-ii), as well as a % of double positive αSMA/Col-I expression normalized to lean animals (C-iii) (n=3–6/group). For representative pictures of αSMA/Col-I double staining in PAN02 and AK4.4 tumors, please see Figs. S3C–D. Data are shown as mean ± SEM. P values were determined by the Student t-test. *, P < 0.05; **, P < 0.01.
Figure 3
Figure 3. Obesity-aggravated desmoplasia is associated with impaired perfusion, oxygenation, drug delivery and resistance to chemotherapy
(A) Effect of diet-induced obesity (DIO) on tumor perfusion. (A-i) Representative pictures of CD31(+) vessels and lectin in PAN02 tumors. Scale bars: 200 µm (A-ii) Quantification of total (CD31+) and lectin-positive (CD31/lectin+) vessel area in PAN02 and AK4.4 tumors. Obese mice presented with decreased perfusion (n = 3–12 tumors/group). (B) Effect of DIO on tumor hypoxia. (B-i) Each lane represents the protein expression of hypoxia markers in individual PAN02 or AK4.4 tumors. (B-ii) Densitometric analysis (fold-change compared to the lean group) normalized to β-actin (n = 4–15. See additional bands in Supplementary Figure 4). Obese mice presented with increased hypoxia in tumors. (C) Effect of DIO on the delivery of chemotherapy to PAN02 tumors. 5-FU quantified via high-performance liquid chromatography (HPLC). Obesity decreased delivery of the chemotherapeutic agent (n=4 tumors/group). (D) Effect of DIO on response to chemotherapy. PAN02 and AK4.4 tumors were orthotopically implanted at ten weeks of diet, treatments were initiated at day seven post-implantation and tumors resected at day 19 (after three cycles of 5-FU 30mg/kg q4d). 5-FU was less effective in preventing tumor growth in obese animals than in lean (two-way ANOVA, n=6–10/group). Data are shown as mean ± SEM. P values were determined by the Student t-test unless otherwise stated. *, P < 0.05; **, P < 0.01.
Figure 4
Figure 4. Blockade of AT1 reverses the obesity-aggravated desmoplasia and improves response to chemotherapy
(A) Effect of obesity on activation of major signaling pathways in tumors. (A-i) Each lane represents the protein expression in individual tumors. (A-ii) Densitometric analysis normalized to β-actin. Obesity associates with increased signaling activity. (B) Effect of obesity on target genes of AT1 signaling. Depicted genes where at least a ~ 2-fold change in mRNA expression was observed in either tumor model. Data normalized to lean group. 3–4 samples per group pooled in one single PCR array fibrosis gene set plate. Expression of genes associated with AT1 pathway activation and fibrosis/desmoplasia is increased in PAN02 and AK4.4 tumors from obese mice. (C) Effect of losartan (Los) on αSMA expression in AK4.4 tumors. (C-i) Each lane represents the protein expression in individual tumors. Losartan reduced tumor αSMA protein expression more dramatically in the obese setting. (C-ii) Densitometric analysis normalized to tubulin. (D) Effect of losartan on collagen levels. Losartan reduced tumor fibrillar collagen as determined by second harmonic generation (SHG) (D-i) as well as collagen-1 (Col-I) expression (D-ii) in AK4.4 tumors from obese mice. Scale bars: 100 µm (SHG) and 1 mm (Col-I). (D-iii-v) Quantification of collagen was performed as a % of a region of interest (ROI) for SHG (n=4 tumors/group, 8 ROIs per tumor) and as a % of viable tumor area in the whole tumor for collagen-1 immunofluorescence (n=4–6 tumors/group). (E) Effect of losartan on tumor desmoplasia and AT1 signaling related markers in AK4.4 tumors from lean and obese mice. (D-i) Protein expression by Western blotting of AK4.4 tumors (each lane represents the protein expression in individual tumors) revealed that losartan normalized the obesity-augmented expression of several AT1 signaling and desmoplasia-related markers, i.e. AT1, TGFB, SMAD2, vimentin, snail, MMP9, and phospho-p38. Of note, similar to αSMA, the changes in AT1, as well as other desmoplasia related markers, were relatively mild in the lean setting. (E-ii) Densitometric analysis normalized to tubulin (Depicted are significant differences between control and losartan treatment). (F) Effect of pharmacological and genetic blockade of AT1 on the efficacy of chemotherapy in the lean and obese setting. (F-i) In the PAN02 model, losartan and AT1 genetic deficiency (Agtr1a−/− mice) improved response to chemotherapy in obese, but not in lean animals. (F-ii) In the AK4.4 model, losartan improved response to chemotherapy in both lean and obese settings but with a higher magnitude in obese setting (i–ii: Two-way ANOVA, n=4–8 tumors/group. Depicted are significant differences between treatment groups compared to control or 5-FU groups). Data are shown as mean ± SEM with the exception of panels Ai–ii. P values were determined by the Student t-test unless otherwise stated. *, P < 0.05; **, P < 0.01, *** p < 0.001.
Figure 5
Figure 5. Tumor-associated neutrophils mediate obesity-induced tumor progression and aggravated desmoplasia
(A) Effect of obesity on immune cell infiltration in PDACs. Obesity promoted infiltration of myeloid CD11b(+)Gr-1(+)F4/80(−) cell population in PAN02 tumors in obese mice. Quantification normalized by total viable cells (i) or total CD45 leucocytes (ii) (n=4–6 tumors/group). (B) Effect of TAN depletion (TAN-D) on PDAC growth in obese mice. TAN depletion from day 1 using anti-Ly6G specific pharmacological inhibitory antibody in obese mice significantly reverted the obesity-increased tumor weight in PAN02 and AK4.4 models (n=4–6 tumors/group). (C) Preferential accumulation of TANs in areas with activated PSCs. Scale bars: 1 mm (whole tumors) and 100 µm (caption). (D) TAN depletion decreased activated PSCs in obese PDACs to the level of lean tumors. Representative pictures (i) and quantification of αSMA(+)Col-1(+) double positive cells (ii) (n=4–6 tumors/group). (E) TAN depletion reduced AT1 expression, collagen production, and MMP9 expression in PAN02 tumors in obese animals. (F) TAN depletion led to increasing in perfusion in PAN02 tumors in obese animals. (F-i) % of CD31(+), lectin(+) or double positive vessel density in the viable area of whole tumors. (F-ii) % of CD31 positive vessels co-stained with lectin (n=4–6 tumors/group). Data are shown as mean ± SEM. p values were determined by the Student t-test, or one-way ANOVA for panels C and E. *, p < 0.05; **, p < 0.01, *** p < 0.001.
Figure 6
Figure 6. The adipose microenvironment promotes TAN infiltration and fibrosis via IL-1β
(A) Effect of obesity on cytokine expression in PAN02 tumors. Multiplex protein revealed that PAN02 tumors from obese mice had increased expression of IL-1β (n=4–6 tumors/group). (B) Effect of adipocytes on IL-1β and αSMA expression in PAN02 tumors. (B-i) Representative picture of αSMA and IL-1β expression in adipocyte-rich and poor regions. Scale bars: 200 µm. (B-ii) Quantification of αSMA and IL-1 β expression in adipocyte-rich and poor regions (n = 20 samples/region). IL-1β was abundantly expressed in adipocytes and PSCs in the adipocyte-rich areas where PSCs predominate. (C) Effect of IL-1β and AT1 blockade on immune cell profile. (C-i) Representative flow cytometry scatter plots of CD45(+)CD11b(+)Ly6G(+) tumor-associated neutrophils (TANs), CD8(+) cytotoxic lymphocytes and CD4(+)CD25(+) regulatory T cells in PAN02 tumors in lean and obese setting. Quantification normalized by total viable cells (ii) or total CD4 cells (iii) (n=3–6 tumors/group). Obesity promoted an increase in TANs, a decrease in CD8(+) lymphocytes, and a strong tendency for increased Tregs. An anti-IL1β neutralizing antibody or genetic AT1 blockade decreased CD45(+)CD11b(+)Ly6G(+) TAN infiltration while recovering CD4+ and CD8+Tcells (i-ii) and decreasing Tregs (iii) in obese mice (one-way ANOVA, n=3–6 tumors/group). (D) IL-1β blockade normalized obesity-aggravated tumor growth (one-way ANOVA, n=3–6 tumors/group). (E) IL-1β expression in TANs. Immunofluorescence for PAN02 tumor sections denoting co-localization. Scale bar: 30 µm. (F) TAN depletion using Ly6G specific antibody abolished obesity-induce IL1-β expression in PAN02 tumors. (one-way ANOVA, n=4–6 tumors/group). (G) Representative picture of αSMA and IL-1β expression in PAN02 tumors. Scale bar: 30 µm. Data are shown as mean ± SEM. p values were determined by the Student t-test unless otherwise stated. *, p < 0.05; **, p < 0.01, ***, p < 0.001.
Figure 7
Figure 7. PDACs from obese patients recapitulate the findings in pre-clinical models
(A) Adipocytes in human PDACs in lean and obese patients. (A-i) Representative pictures of adipocytes in human PDAC from patients with normal weight [Body mass index (BMI) <25] and obesity (BMI>30). Scale bars: 100 µm. (A-ii). Quantification of adipocyte size in human PDACs. Tumors from obese patients presented with hypertrophied adipocytes (n=8 tumors/group). (B) Collagen-I and hyaluronan (HA) expression in human PDACs in lean and obese patients. (B-i) Representative pictures of Collagen-I and HA in human PDAC from patients with normal weight (BMI<25) and obesity (BMI>30). Scale bars: 1mm. (B-ii) Quantification of Collagen-I and HA in human PDACs (n=8 tumors/group). Obesity associated with increased levels of collagen-I and hyaluronan. (C) Cumulative survival curves in PDAC patients stratified by chemotherapy in patients with (i) BMI ≤ 25 or (ii) BMI >25. The survival advantage present in the BMI ≤ 25 subgroup is lost in the >25 BMI subgroup. (D) Graphical summary of the key findings of this study. PDACs in obese hosts present with increased fatty stroma, inflammation, and desmoplasia. The amplified crosstalk between CAAs, TANs, and PSCs that occurs in obesity leads to an aggravation of desmoplasia, increased tumor progression and reduced response to chemotherapy.

Comment in

References

    1. American Cancer Society: Cancer Facts and Figures. 2015
    1. Genkinger JM, Spiegelman D, Anderson KE, Bernstein L, van den Brandt PA, Calle EE, et al. A pooled analysis of 14 cohort studies of anthropometric factors and pancreatic cancer risk. International journal of cancer Journal international du cancer. 2011;129:1708–1717. - PMC - PubMed
    1. Yuan C, Bao Y, Wu C, Kraft P, Ogino S, Ng K, et al. Prediagnostic body mass index and pancreatic cancer survival. Journal of clinical oncology : official journal of the American Society of Clinical Oncology. 2013;31:4229–4234. - PMC - PubMed
    1. Calle EE, Rodriguez C, Walker-Thurmond K, Thun MJ. Overweight, obesity, and mortality from cancer in a prospectively studied cohort of U.S. adults. N Engl J Med. 2003;348:1625–1638. - PubMed
    1. McWilliams RR, Matsumoto ME, Burch PA, Kim GP, Halfdanarson TR, de Andrade M, et al. Obesity adversely affects survival in pancreatic cancer patients. Cancer. 2010;116:5054–5062. - PMC - PubMed

Publication types

MeSH terms

Substances