. 2016 Jun 1;143(11):1884-92.
doi: 10.1242/dev.126847.

Development-on-chip: in vitro neural tube patterning with a microfluidic device

Affiliations

Development-on-chip: in vitro neural tube patterning with a microfluidic device

Christopher J Demers et al. Development. .

Abstract

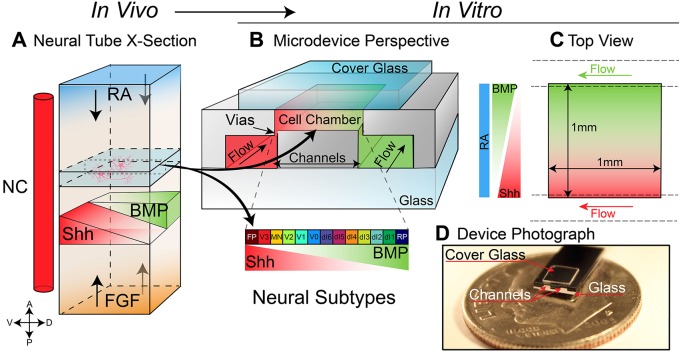
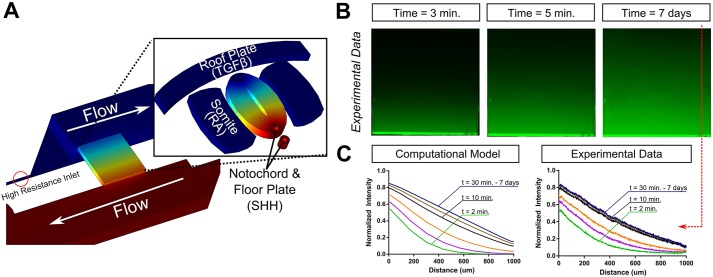
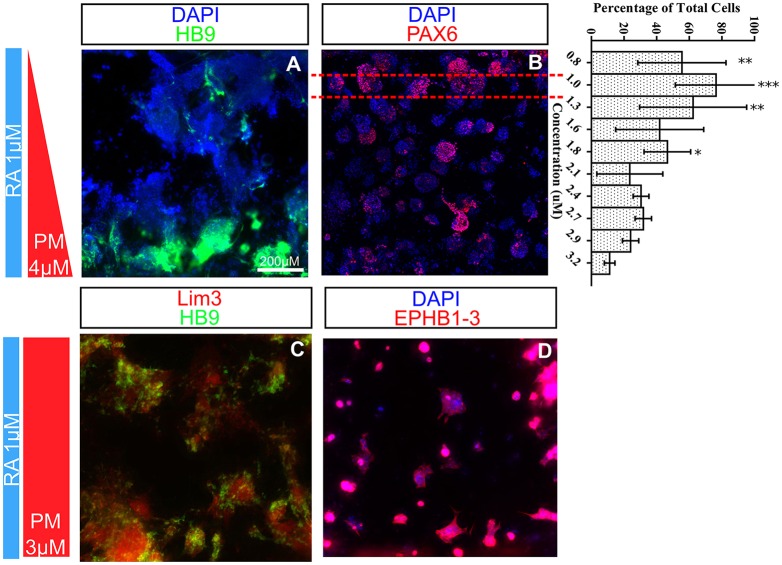
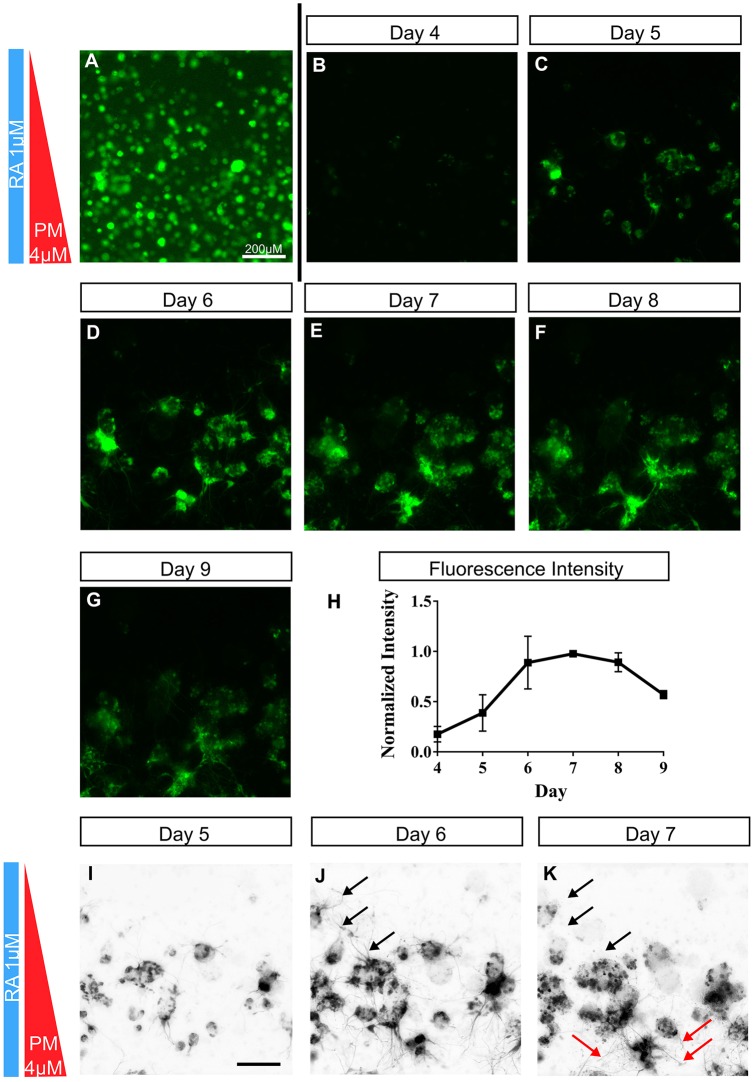
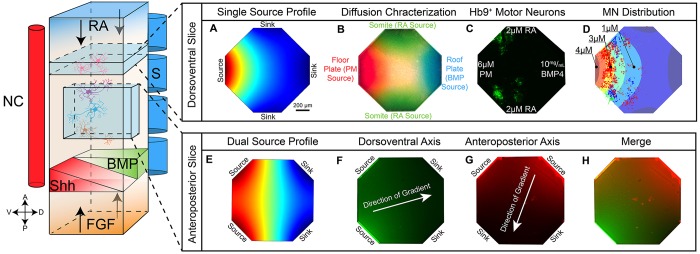
Embryogenesis is a highly regulated process in which the precise spatial and temporal release of soluble cues directs differentiation of multipotent stem cells into discrete populations of specialized adult cell types. In the spinal cord, neural progenitor cells are directed to differentiate into adult neurons through the action of mediators released from nearby organizing centers, such as the floor plate and paraxial mesoderm. These signals combine to create spatiotemporal diffusional landscapes that precisely regulate the development of the central nervous system (CNS). Currently, in vivo and ex vivo studies of these signaling factors present some inherent ambiguity. In vitro methods are preferred for their enhanced experimental clarity but often lack the technical sophistication required for biological realism. In this article, we present a versatile microfluidic platform capable of mimicking the spatial and temporal chemical environments found in vivo during neural tube development. Simultaneous opposing and/or orthogonal gradients of developmental morphogens can be maintained, resulting in neural tube patterning analogous to that observed in vivo.

Keywords: Differentiation; Microfluidic; Mouse; Neuron; Patterning; Stem cell.


Conflict of interest statement

Competing interests

The authors declare no competing or financial interests.

Figures

Fig. 1.
Fig. 1.
Graphical overview of the microfluidic reconstruction of the neural tube. (A,B) Schematic of a neural tube highlighting the 100 µm ‘slice’ recreated by the microfluidic device. Four primary signals (RA, SHH, BMP and FGF) are responsible for patterning the bulk of the neural tube (NC, notochord) (A). The SHH gradient, which is responsible for directing the differentiation of ventral neural progenitors into discrete domains of neurons, is recreated inside the cell culture chamber of the microdevice (B). Flow channels running under the cell chamber supply nutrients as well as desired guidance molecules to the cells in the culture chamber. Morphogen concentration gradients are established across the chamber using the vias in a standard source/sink configuration with the walls of the chamber acting as reflective boundaries. (C) A top (rotated) view of B, as seen through the cover glass. (D) A photograph of the microdevice sitting on top of a dime indicates the scale of the device. FP, floor plate; RP, roof plate.
Fig. 2.
Fig. 2.
Computer simulations of microdevice operation accurately predict device behavior. (A) Using the actual microdevice geometry, a simple linear gradient is modeled in COMSOL, analogous to the SHH gradient established in the neural tube (inset). (B) Time-lapse imaging of the evolution of a fluorescein gradient inside the cell culture chamber of the microdevice, demonstrating that a concentration gradient can be established in the microdevice. (C) Quantification of fluorescence intensity in the predicted computational model and in the fluorescein gradient in the microdevice, highlighting the predictability of microdevice operation as well as the ability of the microdevice to maintain a stable linear gradient over 7 days. Quantification of images performed as one-dimensional average intensities as a function of distance across the microdevice. Quantification is repeated for several time points (2, 3, 5, 10, 15 and 30 minutes) to obtain temporal data.
Fig. 3.
Fig. 3.
Directed spatial patterning in the microfluidic device reveals a region of permissive differentiation. Representative images and average plots of spatial differentiation of HB9+ cells (GFP labeled) along SHH gradient (n=4). Vertical bars on the left diagrammatically indicate the concentration and spatial gradient of RA and/or SHH. Plots to the right indicate the average intensity distribution from at least four experiments as well as actual PM concentrations based on computer simulations (quantified as mean percent cells/bin ±s.d., n=3). (A) Control HB9+ MNs subjected to a uniform concentration of PM and RA. Red dashed lines indicate example bin width. (B-D) HB9+ MNs subjected to varying PM gradients. Inset in C illustrates higher magnification detail of the MN cluster (200× confocal image). (E) The addition of an opposing gradient of BMP4 (20 ng/ml) further narrows the MN domain. (F) High expression of the pluripotency marker OCT4 towards the dorsal end of the microdevice (outside of the permissive MN region) indicates the effect of early exposure to a cross-gradient of BMP4. (G) Live/dead staining with Hoechst 33342 and propidium iodide (PI) reveal that we have not simply created a zone of permissive cell growth. *P≤0.05, **P≤0.01, ***P≤0.001.
Fig. 4.
Fig. 4.
Spatial and temporal expression of transcription factors in vitro consistent with in vivo expression. (A) Staining of post-mitotic cells at day 6 uncovers the presence of non-HB9-expressing cells. (B) As MNs are developing in the ventral portion of the microdevice, PAX6 begins to regress dorsally (quantified as mean percent cells/bin ±s.d., n=3). Red dashed lines indicate example bin width. (C,D) After differentiation (day 9), the HB9+ MNs obtain a medial motor column identity (LIM3+) (C) and express markers of the hindbrain region (EPHB1-3+) (D). *P≤0.05, **P≤0.01, ***P≤0.001.
Fig. 5.
Fig. 5.
Time-lapse imaging in the microdevice reveals dynamic expression patterns. (A) Contrast has been artificially enhanced in this image to illustrate seeding density. (B-G) Images for subsequent days were acquired every 24 h at a constant intensity. (H) Quantification of GFP intensity over time reveals a pattern of expression similar to that found in vivo (mean intensity ±s.d., n=3). (I-K) Inverted images are shown to enhance neurite visibility. Black arrows illustrate regions of omnidirectional neurite growth on day 6 that were redirected towards higher concentrations of PM (red arrows) on day 7.
Fig. 6.
Fig. 6.
Generating overlapping orthogonal gradients in a novel four-port microdevice. Simply adding two additional diffusion ports provides an enhanced user platform with which one can recreate both an ‘Anteroposterior’ or ‘Dorsoventral’ slice of the neural tube. Introducing PM as a single source (equivalent to the neural tube floor plate) with flanking RA sources and an opposing BMP source induces a similar spatial pattern to that seen with the two-port microdevice. (A-D) Concentration profiles and demonstrated HB9 response for a dorsoventral slice of the notochord using four independent sources. (A) Simulated concentration profile for a single species using one source and three sinks. (B) Experimental demonstration of microdevice concentration profiles using each port as a single source for a colored dye. (C) Experimental HB9+ response to the indicated mediator gradients. (D) Color-coded HB9+ distribution plotted for three separate experiments. Calculated SHH concentration gradient is shown as background. (E-H) Concentration profiles demonstrated for an anteroposterior slice of the notochord using the four-channel device. (E) Computer simulation of concentration profiles using two adjacent inputs as a source. Profiles are approximately linear. (F,G) Experimental demonstration the linear gradient using the fluorescent dyes fluorescein (F) and rhodamine (G). (H) Superposition of linear gradients in F and G. NC, notochord; S, somite.

References

    1. Amadi O. C., Steinhauser M. L., Nishi Y., Chung S., Kamm R. D., McMahon A. P. and Lee R. T. (2010). A low resistance microfluidic system for the creation of stable concentration gradients in a defined 3D microenvironment. Biomed. Microdevices 12, 1027-1041. 10.1007/s10544-010-9457-7 - DOI - PMC - PubMed
    1. Arber S., Han B., Mendelsohn M., Smith M., Jessell T. M. and Sockanathan S. (1999). Requirement for the homeobox gene Hb9 in the consolidation of motor neuron identity. Neuron 23, 659-674. 10.1016/S0896-6273(01)80026-X - DOI - PubMed
    1. Baillie-Johnson P., van den Brink S. C., Balayo T., Turner D. A. and Martinez Arias A. (2015). Generation of aggregates of mouse embryonic stem cells that show symmetry breaking, polarization and emergent collective behaviour in vitro. J. Vis. Exp., e53252 10.3791/53252 - DOI - PMC - PubMed
    1. Bain G., Ray W. J., Yao M. and Gottlieb D. I. (1996). Retinoic acid promotes neural and represses mesodermal gene expression in mouse embryonic stem cells in culture. Biochem. Biophys. Res. Commun. 223, 691-694. 10.1006/bbrc.1996.0957 - DOI - PubMed
    1. Bushati N. and Briscoe J. (1994). Regulation of neuronal subtype identity in the vertebrate neural tube (neuronal subtype identity regulation). eLS.

Publication types

Substances