. 2016 Aug 12;36(17):2208-25.
doi: 10.1128/MCB.00144-16. Print 2016 Sep 1.

ZDHHC3 Tyrosine Phosphorylation Regulates Neural Cell Adhesion Molecule Palmitoylation

Affiliations

ZDHHC3 Tyrosine Phosphorylation Regulates Neural Cell Adhesion Molecule Palmitoylation

Patricia Marie-Jeanne Lievens et al. Mol Cell Biol. .

Abstract

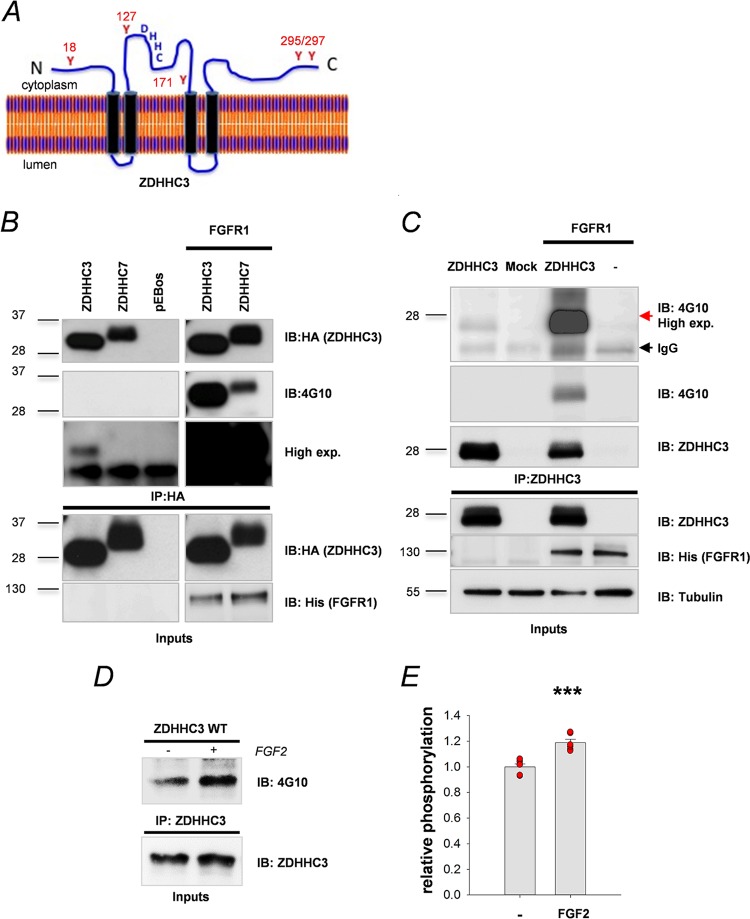
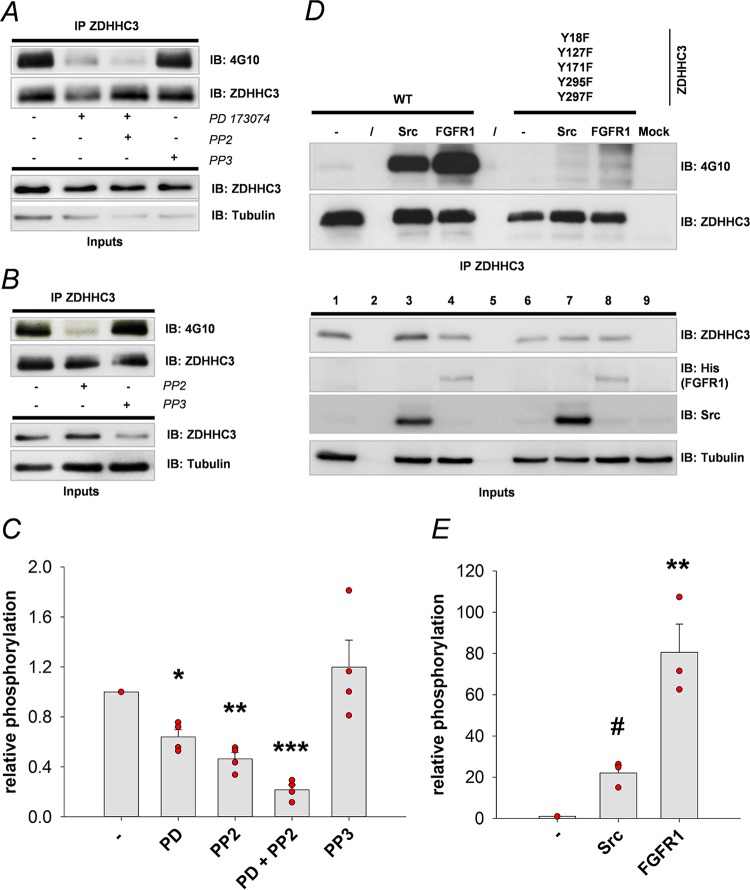
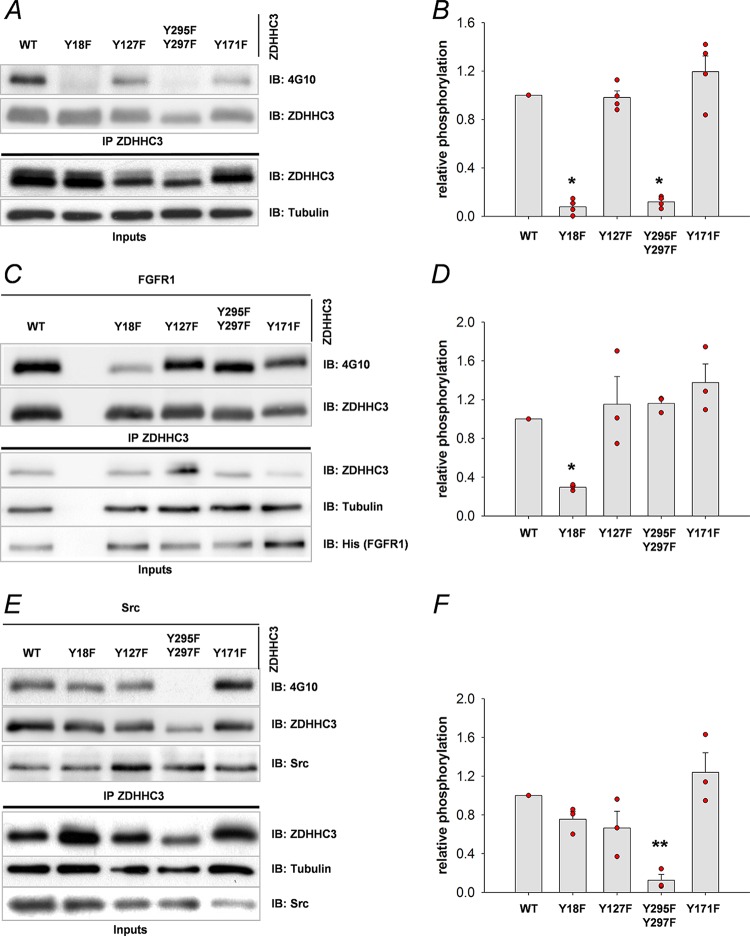
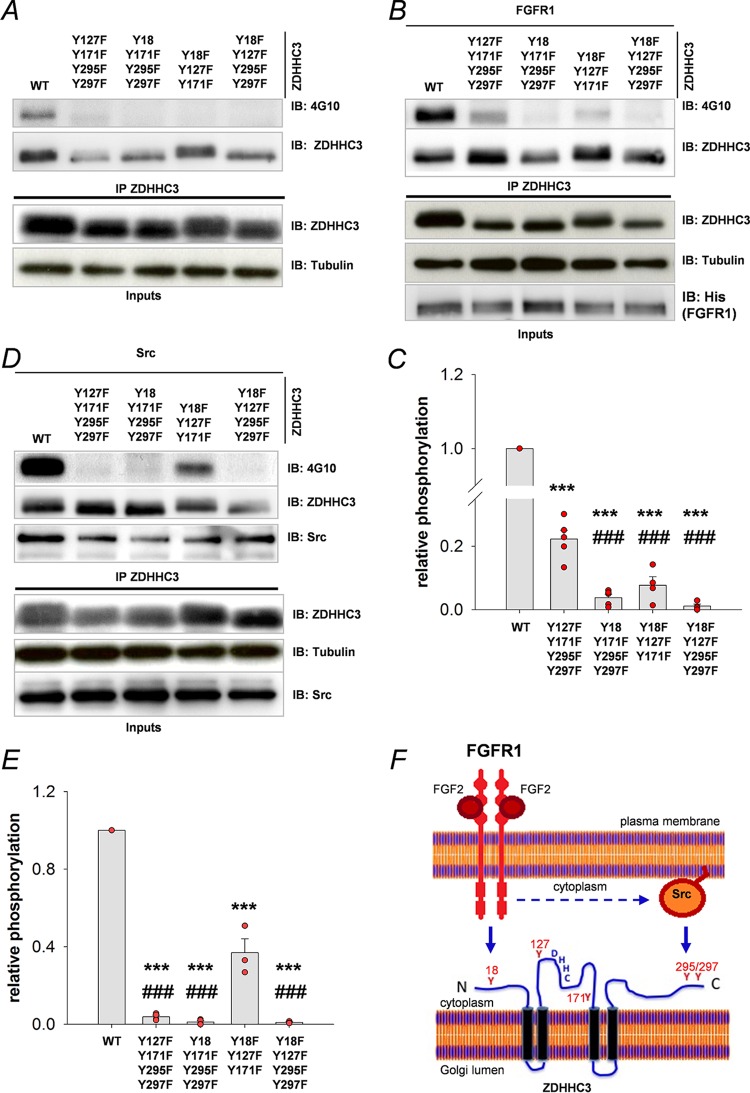
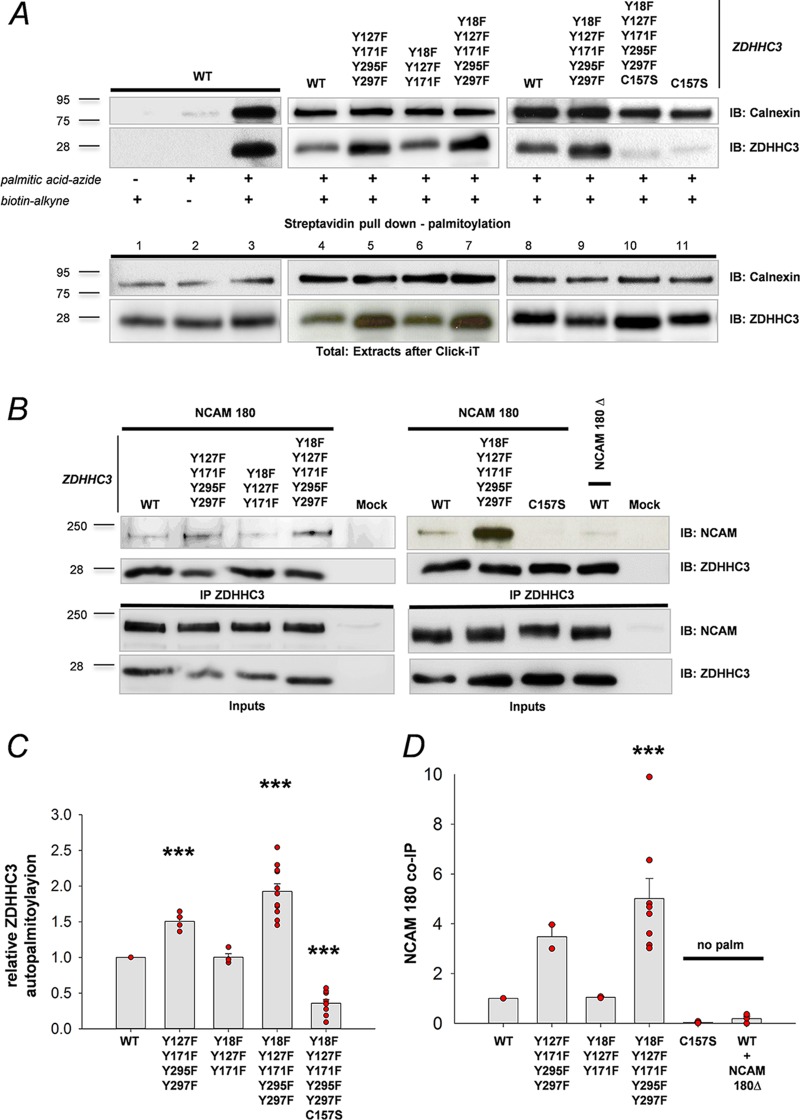
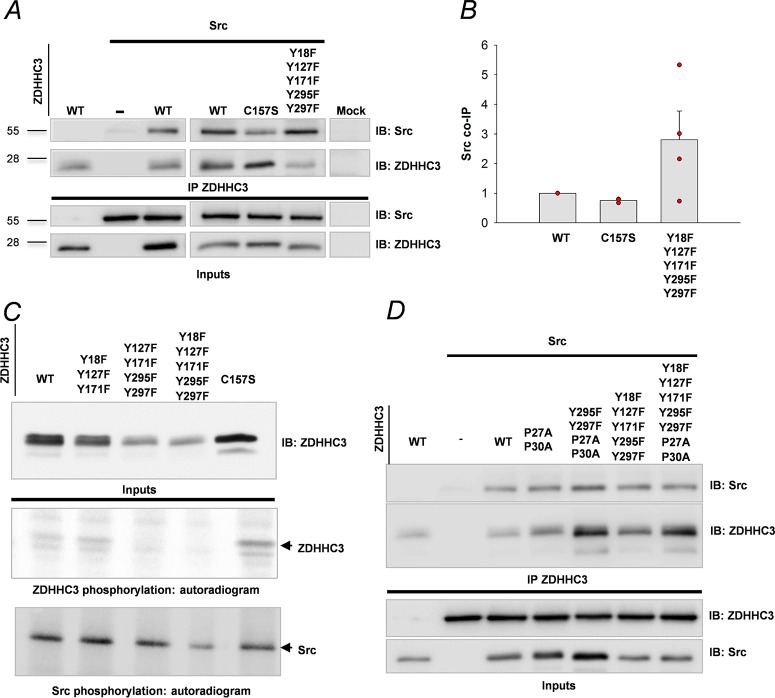
The neural cell adhesion molecule (NCAM) mediates cell-cell and cell-matrix adhesion. It is broadly expressed in the nervous system and regulates neurite outgrowth, synaptogenesis, and synaptic plasticity. Previous in vitro studies revealed that palmitoylation of NCAM is required for fibroblast growth factor 2 (FGF2)-stimulated neurite outgrowth and identified the zinc finger DHHC (Asp-His-His-Cys)-containing proteins ZDHHC3 and ZDHHC7 as specific NCAM-palmitoylating enzymes. Here, we verified that FGF2 controlled NCAM palmitoylation in vivo and investigated molecular mechanisms regulating NCAM palmitoylation by ZDHHC3. Experiments with overexpression and pharmacological inhibition of FGF receptor (FGFR) and Src revealed that these kinases control tyrosine phosphorylation of ZDHHC3 and that ZDHHC3 is phosphorylated by endogenously expressed FGFR and Src proteins. By site-directed mutagenesis, we found that Tyr18 is an FGFR1-specific ZDHHC3 phosphorylation site, while Tyr295 and Tyr297 are specifically phosphorylated by Src kinase in cell-based and cell-free assays. Abrogation of tyrosine phosphorylation increased ZDHHC3 autopalmitoylation, enhanced interaction with NCAM, and upregulated NCAM palmitoylation. Expression of ZDHHC3 with tyrosine mutated in cultured hippocampal neurons promoted neurite outgrowth. Our findings for the first time highlight that FGFR- and Src-mediated tyrosine phosphorylation of ZDHHC3 modulates ZDHHC3 enzymatic activity and plays a role in neuronal morphogenesis.


Figures

FIG 1
FIG 1
FGFR1 induces ZDHHC3 tyrosine phosphorylation in N2a cells. (A) Topology of ZDHHC3. DHHC indicates the conserved catalytic cysteine-rich domain. Putative tyrosine phosphorylation sites (Y) facing the cytoplasm and their positions are shown in red. (B) HA-tagged ZDHHC3 and ZDHHC7 were transfected in N2a cells alone or together with His-tagged FGFR1, immunoprecipitated with anti-HA antibodies, and analyzed by IB with antiphosphotyrosine (4G10) or anti-HA antibody. Expression (exp.) of FGFR1 was confirmed by IB. Molecular masses (in kilodaltons) are shown on the left. (C) After transfection of N2a cells, untagged ZDHHC3 was immunoprecipitated with anti-ZDHHC3 antibody and analyzed by IB with antiphosphotyrosine (4G10) or anti-ZDHHC3 antibody. Expression of FGFR1 was confirmed by IB. Expression of tubulin was used as an internal control. Molecular masses (in kilodaltons) are shown on the left. Black arrow, phosphorylated ZDHHC3; red arrow, light chains of immunoglobulin G (IgG; used for IP). (D) N2a cells expressing untagged ZDHHC3 were treated with 50 ng/ml of FGF2 or vehicle for 1 h, followed by IB analysis with antiphosphotyrosine (4G10) or anti-ZDHHC3 antibody. (E) Statistical evaluation of FGF2-mediated ZDHHC3 phosphorylation. The bars represent means plus SEM. Dots represent values obtained in individual experiments. ***, P = 0.0003 (n = 6).
FIG 2
FIG 2
ZDHHC3 tyrosine phosphorylation is regulated by both FGFR and Src kinases. (A) N2a cells were transfected with ZDHHC3 and treated for 2 h with the FGFR inhibitor PD173074 (5 μM) alone or together with the Src inhibitor PP2 (10 μM). An inactive analogue of PP2 (PP3) (10 μM) was used as a negative control. Tyrosine phosphorylation of immunoprecipitated ZDHHC3 was assessed by IB with 4G10 antibody. (B) ZDHHC3 tyrosine phosphorylation after 2-h application of PP2 (10 μM) or PP3 (10 μM). (C) Statistical evaluation of ZDHHC3 tyrosine phosphorylation calculated as the 4G10/DHHC3 ratio shown in panels A and B. The bars represent means plus SEM. *, P = 0.046; **, P = 0.001; ***, P < 0.001 in comparison to the ZDHHC3wt untreated control group, normalized to 1; n = 4. (D) Tyrosine phosphorylation of ZDHHC3wt or the Y18F-Y127F-Y171F-Y295F-Y297F mutant expressed alone or together with Src or FGFR1. (E) Statistical evaluation of ZDHHC3wt tyrosine phosphorylation as shown in panel D. **, P = 0.006. Also shown is a comparison to the ZDHHC3wt-plus-FGFR1 group (#, P = 0.013; n = 3). (C and E) One-way RM ANOVA with the Holm-Sidak post hoc test was used to compare the groups. Dots represent values obtained in individual experiments.
FIG 3
FIG 3
Tyrosine phosphorylation of ZDHHC3 single-tyrosine mutants. Shown is tyrosine phosphorylation of immunoprecipitated ZDHHC3wt or the single-tyrosine mutants ZDHHC3/Y18F, ZDHHC3/Y127F, ZDHHC3/Y295F-Y297F, and ZDHHC3/Y171F expressed alone (A and B) or coexpressed with FGFR1 (C and D) or Src (E and F) in N2a cells. Representative IBs (A, C, and E) and related graphs with statistical evaluation (B, D, and F) are shown. ZDHHC3 tyrosine phosphorylation was calculated as for Fig. 1. The bars represent means plus SEM. *, P < 0.05 (B); *, P < 0.05 (D); **, P = 0.001 (F) in comparison to ZDHHC3wt. For statistical comparisons, RM ANOVA on ranks followed by the Student-Newman-Keuls method (n = 4) (B) or one-way RM ANOVA with the Holm-Sidak post hoc test (n = 3) (D and F) was used. Dots (B, D, and F) represent values obtained in individual experiments.
FIG 4
FIG 4
Tyrosine phosphorylation of ZDHHC3 triple-tyrosine mutants. (A to E) Tyrosine phosphorylation of immunoprecipitated ZDHHC3wt or the triple-tyrosine mutants ZDHHC3/Y127F-Y171F-Y295F-Y297F, ZDHHC3/Y18F-Y171F-Y295F-Y297F, ZDHHC3/Y18F-Y127F-Y171F, and ZDHHC3/Y18F-Y127F-Y295F-Y297F expressed alone (A) or coexpressed with FGFR1 (B and C) or Src (D and E) in N2a cells. The bars represent means plus SEM. ***, P < 0.001 in comparison to the ZDHHC3wt group; ###, P < 0.001 in comparison to the ZDHHC3/Y127F-Y171F-Y295F-Y297F (C) or ZDHHC3/Y18F-Y127F-Y171F (E) group (one-way RM ANOVA with Holm-Sidak post hoc test; n = 4 or 5 [C]; n = 3 or 4 [E]). (F) Model of site-specific ZDHHC3 tyrosine phosphorylation by FGFR1 and/or Src. Y18 (on the N terminus) is phosphorylated in response to FGFR1 activation, while Y295 and Y297 (on the C terminus) are phosphorylated directly by the Src pathway. Since FGFR may activate Src kinase, it may also phosphorylate Y295 and Y297 through Src. Dots (C and E) represent values obtained in individual experiments.
FIG 5
FIG 5
Palmitoylation of NCAM180 by ZDHHC3wt versus phosphorylation-deficient mutants and role of FGFR activation in NCAM palmitoylation and ZDHHC3 phosphorylation in vivo. (A) N2a cells were cotransfected with NCAM180 and ZDHHC3wt, its dominant-negative mutant C157S, or phosphorylation-deficient mutants; labeled with [3H]palmitate; and subjected to immunoprecipitation with anti-NCAM antibody, followed by SDS-PAGE and fluorography. (B) The intensity of the NCAM180 [3H]palmitate labeling was assessed by densitometry of fluorograms relative to protein levels estimated by immunoblotting. The value for cells transfected with ZDHHC3wt was set to 100%. The bars represent means plus SEM (n = 3 or 4). The statistically significant difference between ZDHHC3wt and ZDHHC3/C157S (P = 0.022), ZDHHC3/Y127F-Y171F-Y295F-Y297F (P = 0.001), or ZDHHC3/Y18F-Y127F-Y171F-Y295F-Y297F (P = 0.046) is indicated (*, P < 0.05; **, P < 0.01), as well as that between ZDHHC3/Y127F-Y171F-Y295F-Y297F and ZDHHC3/Y18F-Y127F-Y171F-Y295F-Y297F (#, P = 0.035) (one-way RM ANOVA with Holm-Sidak post hoc test). (C) Representative ABE analysis of NCAM palmitoylation in mouse brain treated with vehicle/FGF2, followed by SDS-PAGE and Western blotting. The samples without hydroxylamine (− HA) functioned as a negative control for specific palmitoyl biotinylation. Shown is a representative blot from at least three independent experiments. (D) Statistical evaluation of NCAM140 and NCAM180 palmitoylation. Injection of FGF2 increases palmitoylation of endogenous NCAM140 and NCAM180 by 12.8% ± 1.3% (n = 4) and by 37.3% ± 1.3% (n = 3), respectively. The bars represent means plus SEM. ***, P < 0.001. (E) Representative blots showing tyrosine phosphorylation (left) and expression (right) of endogenous ZDHHC3 in mouse brain after s.c. injection of FGF2 or vehicle in two independent experiments (Exp.). Administration of FGF2 facilitates phosphorylation of dimeric, ∼60-kDa ZDHHC3 (top) rather than its monomeric form (bottom). Dots (B and D) represent values obtained in individual experiments.
FIG 6
FIG 6
Mutation of tyrosines enhances ZDHHC3 autopalmitoylation and its interaction with NCAM. (A) Autopalmitoylation of transfected wt or mutant ZDHHC3 into N2a cells was analyzed by Click-iT chemistry. Calnexin served as an internal positive control. As a negative control, a click reaction was performed without palmitic acid-azide or biotin-alkyne. Palmitoylated ZDHHC3 or calnexin pulled down by streptavidin-Sepharose beads was detected by IB with specific antibodies. The relative total amount of these proteins after the Click-iT reaction was determined by IB of extracts, shown below the line. (B) NCAM180 or NCAM180Δ coimmunoprecipitating with wt or mutant ZDHHC3 was analyzed after ZDHHC3 IP by IB with anti-NCAM antibodies. The amount of ZDHHC3 in IP was detected on the same membrane. ZDHHC3 and NCAM180 expression was confirmed by IB of the lysates. (C and D) Statistical evaluation of ZDHHC3 autopalmitoylation, calculated as the palmitoylated/total ratio. The bars represent means plus SEM. ***, P < 0.001 in comparison to ZDHHC3wt (one-way RM ANOVA with Holm-Sidak posttest). Dots (C and D) represent values obtained in individual experiments.
FIG 7
FIG 7
Src interacts with and phosphorylates ZDHHC3. (A) Src and ZDHHC3wt or the indicated mutant forms were transfected in SYF−/− cells separately or together. After immunoprecipitation of ZDHHC3, the amount of Src pulled down together with ZDHHC3 was analyzed by WB with anti-Src antibodies. Expression of ZDHHC3 and Src was confirmed by WB of the extracts with specific antibodies, shown below the line. (B) Statistical evaluation of Src co-IP. The bars represent means plus SEM. n = 3 for the second group; n = 4 for the first and third groups. There were no significant differences between groups. Dots represent values obtained in individual experiments. (C) In vitro Src kinase assay. ZDHHC3wt or the indicated mutants were transfected in N2a cells. After immunoprecipitation, samples were incubated with purified Src kinase together with [γ-33P]ATP, followed by SDS-PAGE and fluorography (below the line). The blot above the line shows the expression levels of the different ZDHHC3 molecules after IP. Autophosphorylation of Src is shown in the bottom blot. The data are representative of the results of three independent experiments. (D) ZDHHC3wt or mutants bearing the additional P27A-P30A mutations were transfected in N2a cells, along with Src, followed by the pulldown assay. Representative blots demonstrating expression of ZDHHC3 and Src are shown below the line.
FIG 8
FIG 8
Mutation of tyrosines in ZDHHC3 stimulates neurite outgrowth. (A) Representative images of DIV2 hippocampal neurons cotransfected with EGFP (green channel), together with an empty vector (−; first control group), ZDHHC3wt (second group), or the ZDHHC3 tyrosine mutant (Y18F-Y127F-Y1717F-Y295F-Y297F) (third group), stained with β-tubulin III (red), and mounted with DAPI (blue)-containing medium. (B to D) Statistical evaluation of the total length of all neurites (B), the number of primary neurites (C), and the length of the longest neurite (D) of cells positive for both β-tubulin III and EGFP. The bars show means plus SEM. The mean values within each transfection were normalized to the control group (set to 100%). *, P < 0.05; **, P < 0.01 (one-way RM ANOVA with Holm-Sidak post hoc test). The number of culture preparations/transfections was 4; the number of coverslips was 8 (2 per transfection); and the total numbers of neurons analyzed were 358, 347, and 270 for the first, second, and third groups, respectively. Dots represent values obtained in individual experiments.

Similar articles

Cited by

References

    1. Planey SL, Zacharias DA. 2009. Palmitoyl acyltransferases, their substrates, and novel assays to connect them. Mol Membr Biol 26:14–31. doi: 10.1080/09687680802646703. - DOI - PubMed
    1. Draper JM, Smith CD. 2009. Palmitoyl acyltransferase assays and inhibitors. Mol Membr Biol 26:5–13. doi: 10.1080/09687680802683839. - DOI - PMC - PubMed
    1. Greaves J, Chamberlain LH. 2011. DHHC palmitoyl transferases: substrate interactions and (patho)physiology. Trends Biochem Sci 36:245–253. doi: 10.1016/j.tibs.2011.01.003. - DOI - PubMed
    1. Korycka J, Lach A, Heger E, Boguslawska DM, Wolny M, Toporkiewicz M, Augoff K, Korzeniewski J, Sikorski AF. 2012. Human DHHC proteins: a spotlight on the hidden player of palmitoylation. Eur J Cell Biol 91:107–117. doi: 10.1016/j.ejcb.2011.09.013. - DOI - PubMed
    1. Little EB, Edelman GM, Cunningham BA. 1998. Palmitoylation of the cytoplasmic domain of the neural cell adhesion molecule N-CAM serves as an anchor to cellular membranes. Cell Adhes Commun 6:415–430. doi: 10.3109/15419069809109150. - DOI - PubMed

Publication types