

Phosphatase Rtr1 Regulates Global Levels of Serine 5 RNA Polymerase II C-Terminal Domain Phosphorylation and Cotranscriptional Histone Methylation
- PMID: 27247267
- PMCID: PMC4985930
- DOI: 10.1128/MCB.00870-15
Phosphatase Rtr1 Regulates Global Levels of Serine 5 RNA Polymerase II C-Terminal Domain Phosphorylation and Cotranscriptional Histone Methylation
Abstract
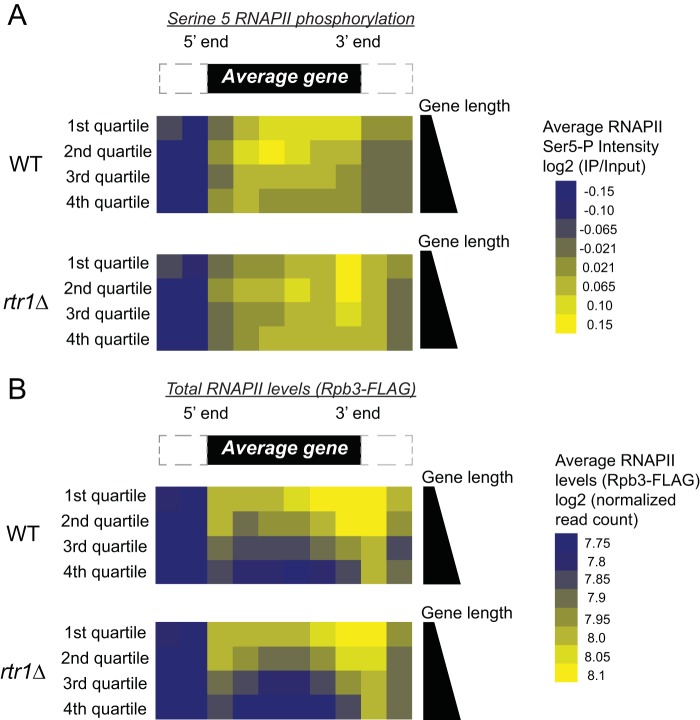
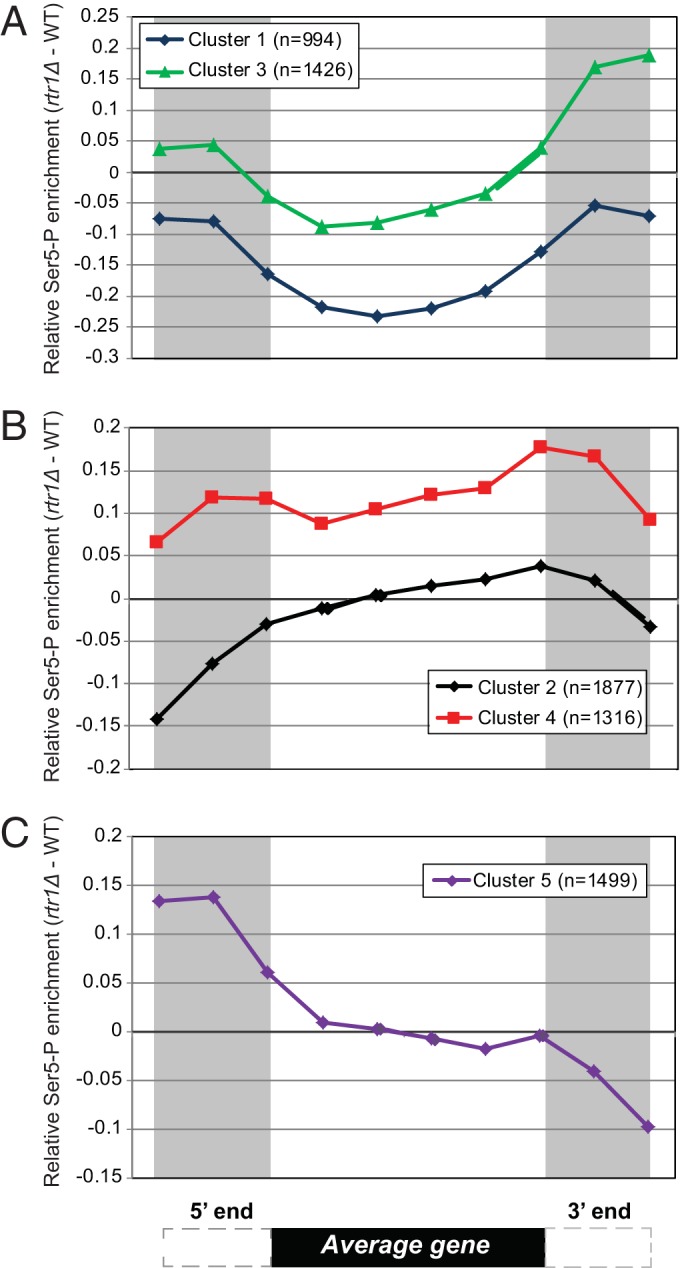
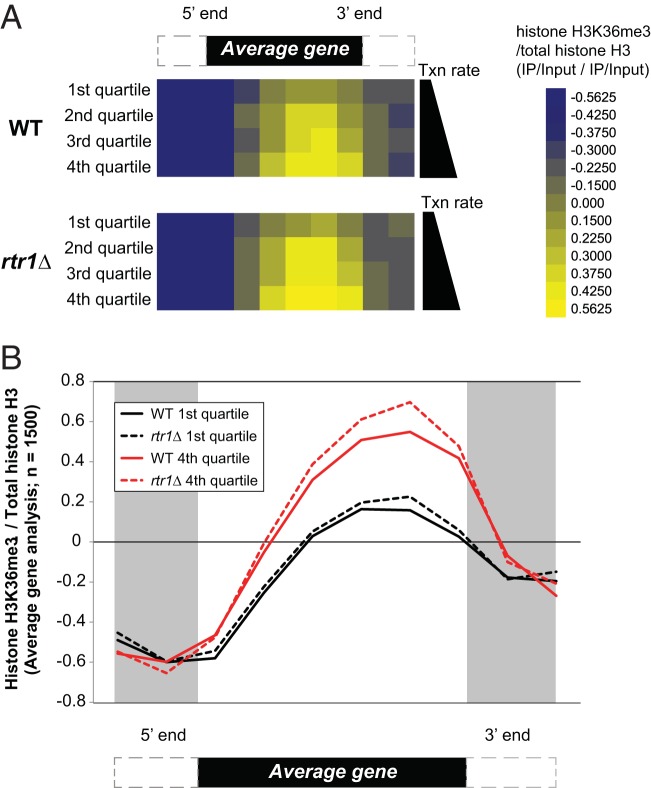
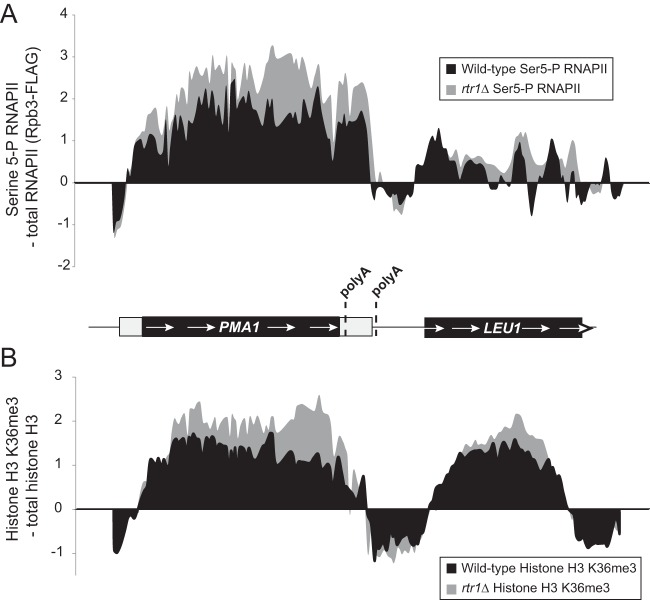
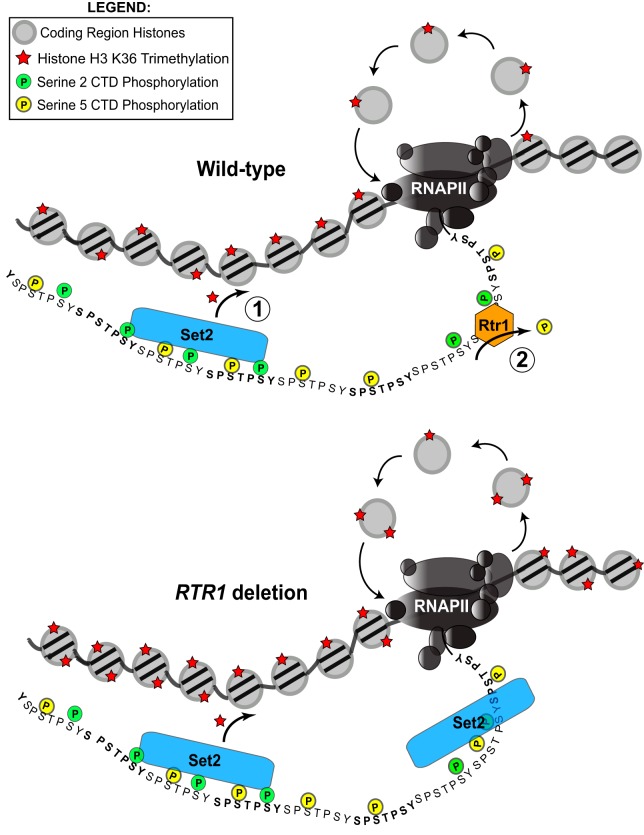
In eukaryotes, the C-terminal domain (CTD) of Rpb1 contains a heptapeptide repeat sequence of (Y1S2P3T4S5P6S7)n that undergoes reversible phosphorylation through the opposing action of kinases and phosphatases. Rtr1 is a conserved protein that colocalizes with RNA polymerase II (RNAPII) and has been shown to be important for the transition from elongation to termination during transcription by removing RNAPII CTD serine 5 phosphorylation (Ser5-P) at a selection of target genes. In this study, we show that Rtr1 is a global regulator of the CTD code with deletion of RTR1 causing genome-wide changes in Ser5-P CTD phosphorylation and cotranscriptional histone H3 lysine 36 trimethylation (H3K36me3). Using chromatin immunoprecipitation and high-resolution microarrays, we show that RTR1 deletion results in global changes in RNAPII Ser5-P levels on genes with different lengths and transcription rates consistent with its role as a CTD phosphatase. Although Ser5-P levels increase, the overall occupancy of RNAPII either decreases or stays the same in the absence of RTR1 Additionally, the loss of Rtr1 in vivo leads to increases in H3K36me3 levels genome-wide, while total histone H3 levels remain relatively constant within coding regions. Overall, these findings suggest that Rtr1 regulates H3K36me3 levels through changes in the number of binding sites for the histone methyltransferase Set2, thereby influencing both the CTD and histone codes.
Copyright © 2016, American Society for Microbiology. All Rights Reserved.
Figures
Similar articles
-
Rtr1 is a CTD phosphatase that regulates RNA polymerase II during the transition from serine 5 to serine 2 phosphorylation.Mol Cell. 2009 Apr 24;34(2):168-78. doi: 10.1016/j.molcel.2009.02.025. Mol Cell. 2009. PMID: 19394294 Free PMC article.
-
RNA Polymerase II CTD phosphatase Rtr1 fine-tunes transcription termination.PLoS Genet. 2020 Mar 18;16(3):e1008317. doi: 10.1371/journal.pgen.1008317. eCollection 2020 Mar. PLoS Genet. 2020. PMID: 32187185 Free PMC article.
-
The interactome of the atypical phosphatase Rtr1 in Saccharomyces cerevisiae.Mol Biosyst. 2014 Jul;10(7):1730-41. doi: 10.1039/c4mb00109e. Mol Biosyst. 2014. PMID: 24671508 Free PMC article.
-
Dynamic phosphorylation patterns of RNA polymerase II CTD during transcription.Biochim Biophys Acta. 2013 Jan;1829(1):55-62. doi: 10.1016/j.bbagrm.2012.08.013. Epub 2012 Sep 7. Biochim Biophys Acta. 2013. PMID: 22982363 Review.
-
Tails of intrigue: phosphorylation of RNA polymerase II mediates histone methylation.Cell. 2003 May 16;113(4):429-32. doi: 10.1016/s0092-8674(03)00360-x. Cell. 2003. PMID: 12757703 Review.
Cited by
-
Writing a wrong: Coupled RNA polymerase II transcription and RNA quality control.Wiley Interdiscip Rev RNA. 2019 Jul;10(4):e1529. doi: 10.1002/wrna.1529. Epub 2019 Mar 7. Wiley Interdiscip Rev RNA. 2019. PMID: 30848101 Free PMC article. Review.
-
RIMA-Dependent Nuclear Accumulation of IYO Triggers Auxin-Irreversible Cell Differentiation in Arabidopsis.Plant Cell. 2017 Mar;29(3):575-588. doi: 10.1105/tpc.16.00791. Epub 2017 Feb 21. Plant Cell. 2017. PMID: 28223441 Free PMC article.
-
The Association of Rpb4 with RNA Polymerase II Depends on CTD Ser5P Phosphatase Rtr1 and Influences mRNA Decay in Saccharomyces cerevisiae.Int J Mol Sci. 2022 Feb 11;23(4):2002. doi: 10.3390/ijms23042002. Int J Mol Sci. 2022. PMID: 35216121 Free PMC article.
-
Protein phosphatases of Saccharomyces cerevisiae.Curr Genet. 2019 Feb;65(1):41-55. doi: 10.1007/s00294-018-0884-y. Epub 2018 Sep 17. Curr Genet. 2019. PMID: 30225534 Free PMC article. Review.
-
RNA Pol II Assembly Affects ncRNA Expression.Int J Mol Sci. 2023 Dec 29;25(1):507. doi: 10.3390/ijms25010507. Int J Mol Sci. 2023. PMID: 38203678 Free PMC article.
References
-
- Barron-Casella E, Corden JL. 1992. Conservation of the mammalian RNA polymerase II largest-subunit C-terminal domain. J Mol Evol 35:405–410. - PubMed
MeSH terms
Substances
Grants and funding
LinkOut - more resources
Full Text Sources
Other Literature Sources
Molecular Biology Databases