

Polycomb Group Protein Pcgf6 Acts as a Master Regulator to Maintain Embryonic Stem Cell Identity
- PMID: 27247273
- PMCID: PMC4888081
- DOI: 10.1038/srep26899
Polycomb Group Protein Pcgf6 Acts as a Master Regulator to Maintain Embryonic Stem Cell Identity
Abstract
The polycomb repressive complex 1 (PRC1) is a multi-subunit complex that plays critical roles in the epigenetic modulation of gene expression. Here, we show that the PRC1 component polycomb group ring finger 6 (Pcgf6) is required to maintain embryonic stem cell (ESC) identity. In contrast to canonical PRC1, Pcgf6 acts as a positive regulator of transcription and binds predominantly to promoters bearing active chromatin marks. Pcgf6 is expressed at high levels in ESCs, and knockdown reduces the expression of the core ESC regulators Oct4, Sox2, and Nanog. Conversely, Pcgf6 overexpression prevents downregulation of these factors and impairs differentiation. In addition, Pcgf6 enhanced reprogramming in both mouse and human somatic cells. The genomic binding profile of Pcgf6 is highly similar to that of trithorax group proteins, but not of PRC1 or PRC2 complexes, suggesting that Pcgf6 functions atypically in ESCs. Our data reveal novel roles for Pcgf6 in directly regulating Oct4, Nanog, Sox2, and Lin28 expression to maintain ESC identity.
Figures
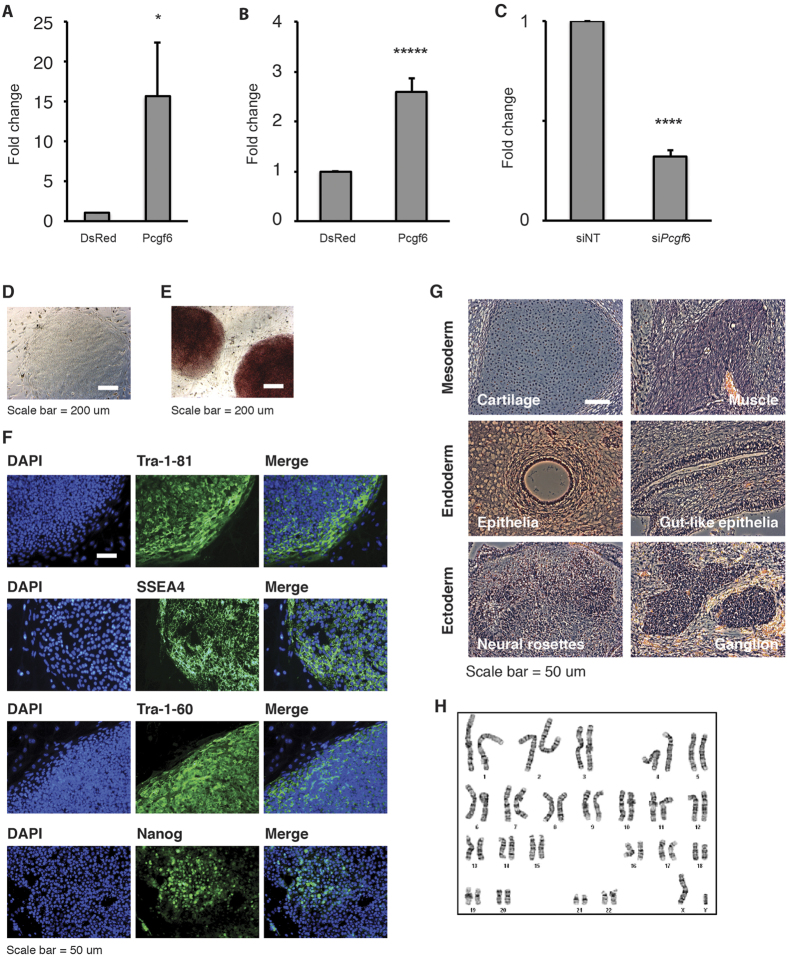
 . ****p < 0.00005 by Student’s t-test. (D–F) Images of Pcgf6-hiPSCs derived as in (B). Cells were cultured on feeders for at least 4 passages before imaging of: cell morphology (D), AP staining (E), and Tra-1-81, SSEA4, Tra-1-60, and Nanog immunofluorescence staining (F). Scale bars = 200 μm (D,E) or 50 μm (F). (G) Histological staining of mesodermal, endodermal, and ectodermal tissues in teratomas formed from Pcgf6-hiPSCs. Cells were injected under the kidney capsule of SCID mice, and teratomas were removed and analyzed ~10 weeks later. Scale bar = 50 μm. Images were taken using either phase contrast microscopy or fluorescent microscopy. (H) Normal karyotype of Pcgf6-hiPSCs. Cells were cultured for ~2 months on feeder cells before karyotype analysis. Chromosomes in the metaphase of 20 cells were counted, and 4 cells were examined for G-band staining with band resolution at 450–525. All cells contained normal karyotypes with 46 chromosomes including XY, and no clonal abnormalities were detected.
Similar articles
-
Pcgf6, a polycomb group protein, regulates mesodermal lineage differentiation in murine ESCs and functions in iPS reprogramming.Stem Cells. 2014 Dec;32(12):3112-25. doi: 10.1002/stem.1826. Stem Cells. 2014. PMID: 25187489
-
Successful Derivation of an Induced Pluripotent Stem Cell Line from a Genetically Nonpermissive Enhanced Green Fluorescent Protein-Transgenic FVB/N Mouse Strain.Cell Reprogram. 2019 Oct;21(5):270-284. doi: 10.1089/cell.2019.0019. Cell Reprogram. 2019. PMID: 31596624
-
Direct reprogramming of fibroblasts into epiblast stem cells.Nat Cell Biol. 2011 Jan;13(1):66-71. doi: 10.1038/ncb2136. Epub 2010 Dec 5. Nat Cell Biol. 2011. PMID: 21131959
-
The genetics of induced pluripotency.Reproduction. 2010 Jan;139(1):35-44. doi: 10.1530/REP-09-0024. Reproduction. 2010. PMID: 19605512 Review.
-
The interplay of chromatin and transcription factors during cell fate transitions in development and reprogramming.Biochim Biophys Acta Gene Regul Mech. 2019 Sep;1862(9):194407. doi: 10.1016/j.bbagrm.2019.194407. Epub 2019 Jul 26. Biochim Biophys Acta Gene Regul Mech. 2019. PMID: 31356991 Review.
Cited by
-
A rapid and stable spontaneous reprogramming system of Spermatogonial stem cells to Pluripotent State.Cell Biosci. 2023 Dec 1;13(1):222. doi: 10.1186/s13578-023-01150-z. Cell Biosci. 2023. PMID: 38041111 Free PMC article.
-
PCGF6 controls neuroectoderm specification of human pluripotent stem cells by activating SOX2 expression.Nat Commun. 2022 Aug 6;13(1):4601. doi: 10.1038/s41467-022-32295-z. Nat Commun. 2022. PMID: 35933409 Free PMC article.
-
Acquisition of neural fate by combination of BMP blockade and chromatin modification.iScience. 2023 Sep 9;26(10):107887. doi: 10.1016/j.isci.2023.107887. eCollection 2023 Oct 20. iScience. 2023. PMID: 37771660 Free PMC article.
-
PCGF1 promotes epigenetic activation of stemness markers and colorectal cancer stem cell enrichment.Cell Death Dis. 2021 Jun 19;12(7):633. doi: 10.1038/s41419-021-03914-2. Cell Death Dis. 2021. PMID: 34148069 Free PMC article.
-
MAX controls meiotic entry in sexually undifferentiated germ cells.Sci Rep. 2024 Mar 4;14(1):5236. doi: 10.1038/s41598-024-55506-7. Sci Rep. 2024. PMID: 38433229 Free PMC article.
References
-
- Evans M. J. & Kaufman M. H. Establishment in culture of pluripotential cells from mouse embryos. Nature 292, 154–156 (1981). - PubMed
MeSH terms
Substances
Grants and funding
LinkOut - more resources
Full Text Sources
Other Literature Sources
Molecular Biology Databases
Research Materials
