Clinical Trial
. 2016 Jun 14;113(24):6713-8.
doi: 10.1073/pnas.1606460113. Epub 2016 May 31.

Whole-exome sequencing to analyze population structure, parental inbreeding, and familial linkage

Collaborators, Affiliations
Clinical Trial

Whole-exome sequencing to analyze population structure, parental inbreeding, and familial linkage

Aziz Belkadi et al. Proc Natl Acad Sci U S A. .

Abstract

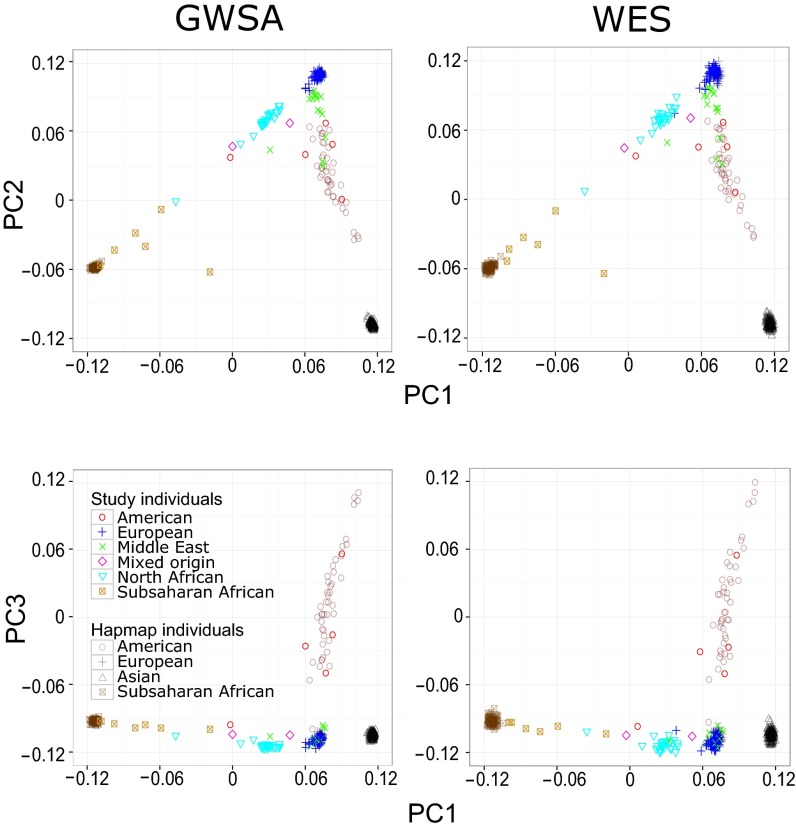
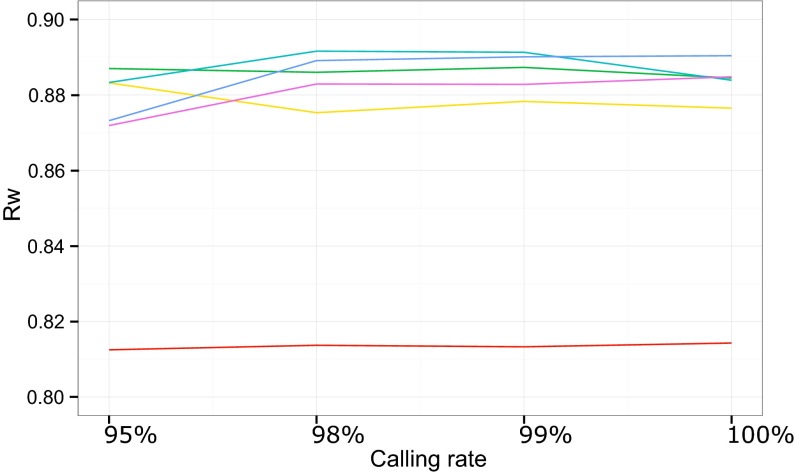
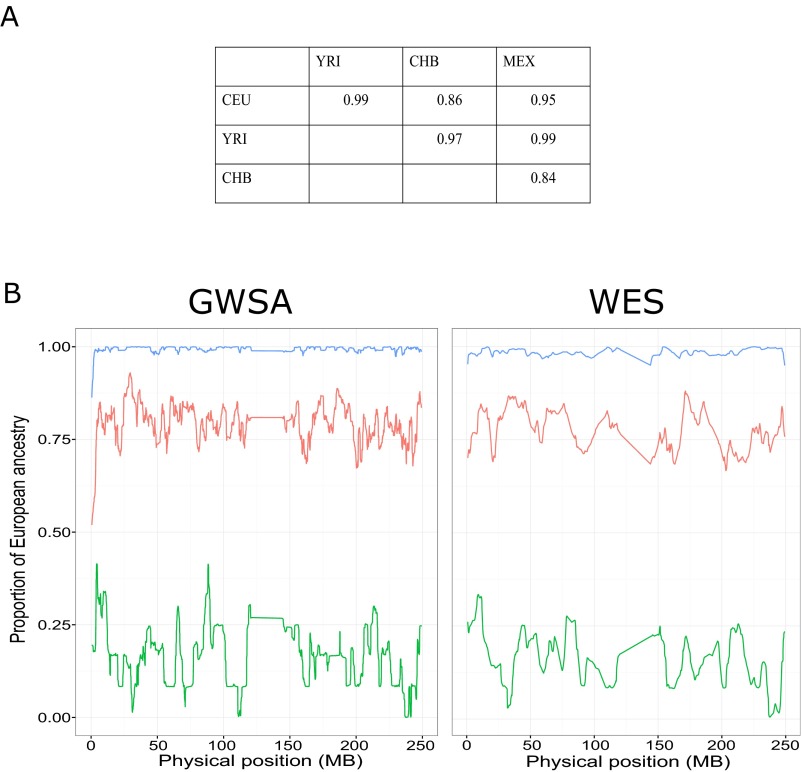
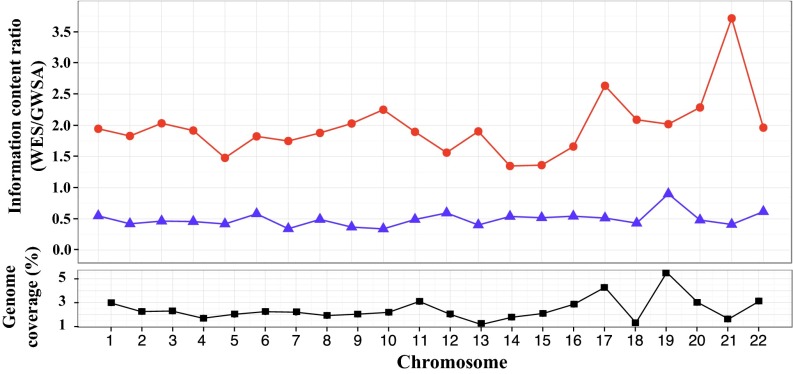
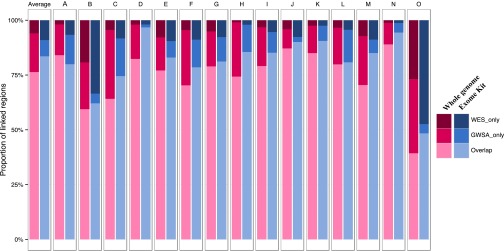
Principal component analysis (PCA), homozygosity rate estimations, and linkage studies in humans are classically conducted through genome-wide single-nucleotide variant arrays (GWSA). We compared whole-exome sequencing (WES) and GWSA for this purpose. We analyzed 110 subjects originating from different regions of the world, including North Africa and the Middle East, which are poorly covered by public databases and have high consanguinity rates. We tested and applied a number of quality control (QC) filters. Compared with GWSA, we found that WES provided an accurate prediction of population substructure using variants with a minor allele frequency > 2% (correlation = 0.89 with the PCA coordinates obtained by GWSA). WES also yielded highly reliable estimates of homozygosity rates using runs of homozygosity with a 1,000-kb window (correlation = 0.94 with the estimates provided by GWSA). Finally, homozygosity mapping analyses in 15 families including a single offspring with high homozygosity rates showed that WES provided 51% less genome-wide linkage information than GWSA overall but 97% more information for the coding regions. At the genome-wide scale, 76.3% of linked regions were found by both GWSA and WES, 17.7% were found by GWSA only, and 6.0% were found by WES only. For coding regions, the corresponding percentages were 83.5%, 7.4%, and 9.1%, respectively. With appropriate QC filters, WES can be used for PCA and adjustment for population substructure, estimating homozygosity rates in individuals, and powerful linkage analyses, particularly in coding regions.

Keywords: exome sequencing; genotyping array; homozygosity mapping; linkage analysis; population structure.


Conflict of interest statement

The authors declare no conflict of interest.

Figures

Fig. S1.
Fig. S1.
Flowchart summarizing the entire WES quality process. First, genotypes for all positions with an SNV (heterozygous or homozygous for the alternative allele) for at least one individual were called. Then, only variants passing the GATK Variant Quality Score Recalibrator (VQSR) filters were kept. Genotypes with a low coverage, genotype quality, or minor read ratio (for heterozygous) were filtered out. Finally, variants with a CR < 90% over our sample of 110 individuals were removed. After merging with the 1000 Genomes Project data, in total, 183,065 SNVs were retained for our analyses, for which we considered four levels of CR between 95% and 100%.
Fig. 1.
Fig. 1.
PCA was performed with smartPCA software on both (Left) GWSA and (Right) WES data. The results for WES data are presented for SNVs with an MAF > 0.03 and a CR > 98%. (Upper) The first two PCs and (Lower) the first and third PCs are plotted. We included a total of 110 individuals (colored plots) and 375 HapMap individuals (black plots) in the analysis.
Fig. 2.
Fig. 2.
Weighted correlation, RW, between the PCA coordinates obtained with GWSA and WES for 110 individuals of our sample as a function of the CR (x axis) and the MAF thresholds used to filter WES SNVs: no MAF filter (red line), MAF > 1% (yellow line), MAF > 2% (green line), MAF > 3% (turquoise line), MAF > 4% (blue line), and MAF > 5% (purple line). RW was calculated as described in Methods.
Fig. S2.
Fig. S2.
Local ancestry estimation. (A) Pearson correlation coefficients between the proportions of ancestry estimated in our 110 individuals using the GWSA or the WES data according to the two ancestral populations considered among the four following HapMap/1000 Genomes Project populations: CEU, YRI, CHB, and MEX. The mean local ancestry was computed over the whole autosomal genome using Hapmix (43). (B) Mean local European ancestry across chromosome 1 estimated by means of Hapmix (43) using (Left) GWSA or (Right) WES data. Represented here are the mean local European ancestries when 44 CEU and 44 YRI from HapMap/1000 Genomes Projects were taken as reference ancestry. The mean probability for each variant for having European or African ancestry is computed for three groups of our sample: 53 individuals of European origin (blue line), 27 individuals of North African origin (red line), and 6 individuals of African origin (green line).
Fig. 3.
Fig. 3.
(Upper) Ratio of information content (IC) for linkage analysis performed with GWSA and WES SNPs calculated with Merlin software. Each dot represents the IC ratio (IC for WES/IC for GWSA). The IC is the mean amount of information for all SNPs per chromosome computed over all of 15 families. Blue triangles indicate the ratio at the whole-genome level; red circles indicate the ratio for the analysis conducted with SNPs located in the regions covered by the SureSelect Exome Kit. (Lower) Black squares indicate the proportion of the whole genome covered by the probes of the SureSelect Exome Kit defined as the number of bases covered by the probes divided by the total length of each chromosome.
Fig. S3.
Fig. S3.
Proportion of linked (LOD score > 1) regions larger than 1 Mb found by homozygosity mapping (with GWSA or WES data) in the whole genome (gradient of pink colors) or the regions covered by the exome kit (gradient of blue colors). Dark colors represent regions found with both analyses (homozygosity mapping with GWSA data and homozygosity mapping with WES data). Intermediate gradient colors represent regions found with GWSA data only. Light colors represent regions found with WES data only. Each pair of bars corresponds to the homozygosity mapping results in one family (A to O), and the first pair is the average proportions over 15 families.

References

    1. Ng SB, et al. Exome sequencing identifies the cause of a Mendelian disorder. Nat Genet. 2010;42(1):30–35. - PMC - PubMed
    1. Bolze A, et al. Whole-exome-sequencing-based discovery of human FADD deficiency. Am J Hum Genet. 2010;87(6):873–881. - PMC - PubMed
    1. Bamshad MJ, et al. Exome sequencing as a tool for Mendelian disease gene discovery. Nat Rev Genet. 2011;12(11):745–755. - PubMed
    1. Kiezun A, et al. Exome sequencing and the genetic basis of complex traits. Nat Genet. 2012;44(6):623–630. - PMC - PubMed
    1. Tennessen JA, et al. Broad GO; Seattle GO; NHLBI Exome Sequencing Project Evolution and functional impact of rare coding variation from deep sequencing of human exomes. Science. 2012;337(6090):64–69. - PMC - PubMed

Publication types

LinkOut - more resources