. 2016 Jun 14;113(24):6689-94.
doi: 10.1073/pnas.1523941113. Epub 2016 May 31.

Digital epidemiology reveals global childhood disease seasonality and the effects of immunization

Affiliations

Digital epidemiology reveals global childhood disease seasonality and the effects of immunization

Kevin M Bakker et al. Proc Natl Acad Sci U S A. .

Abstract

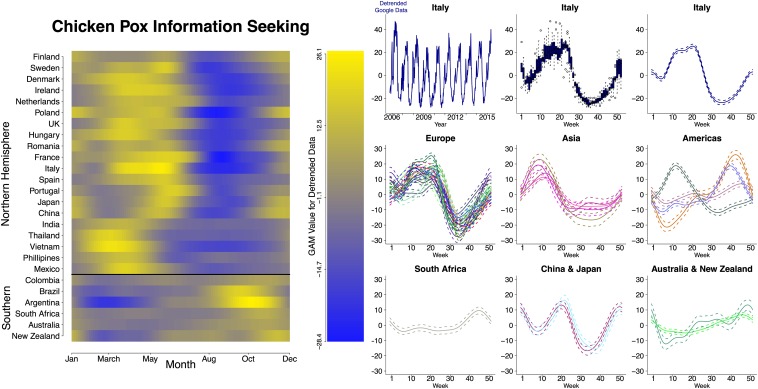
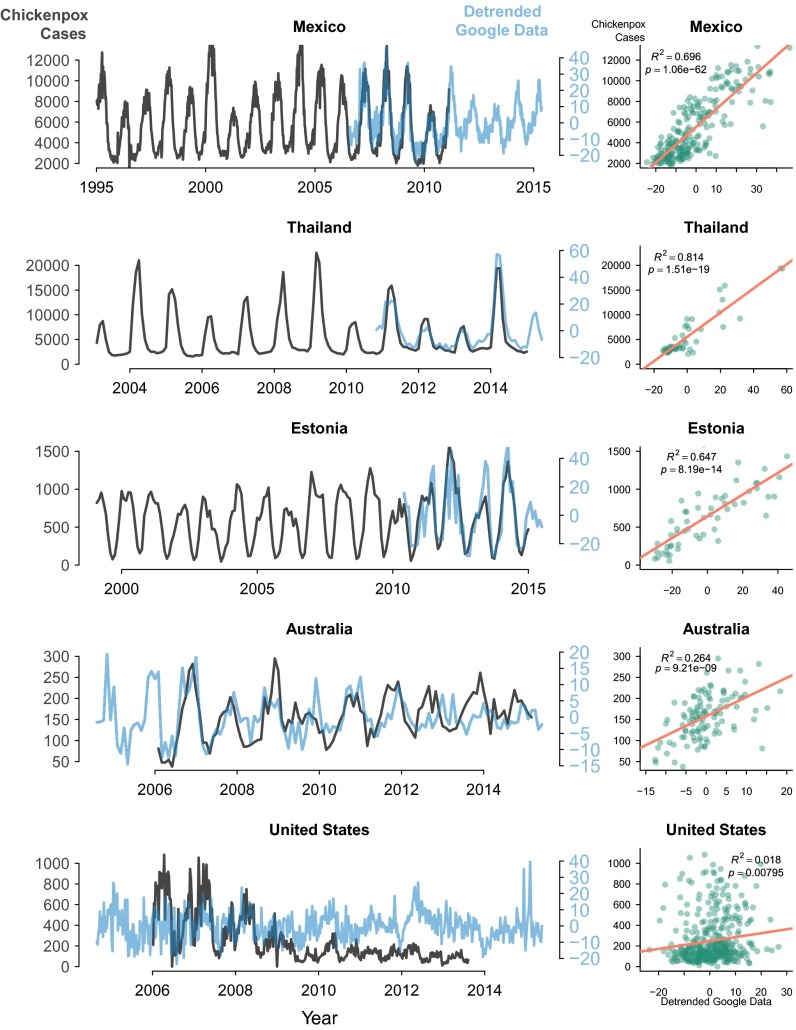
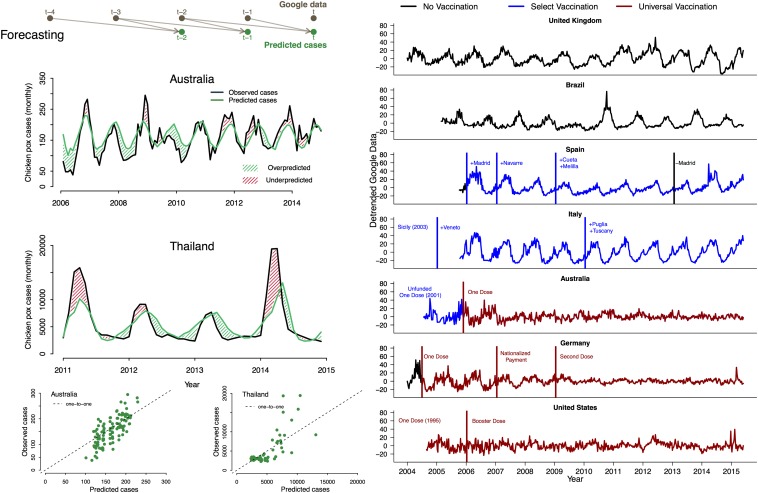
Public health surveillance systems are important for tracking disease dynamics. In recent years, social and real-time digital data sources have provided new means of studying disease transmission. Such affordable and accessible data have the potential to offer new insights into disease epidemiology at national and international scales. We used the extensive information repository Google Trends to examine the digital epidemiology of a common childhood disease, chicken pox, caused by varicella zoster virus (VZV), over an 11-y period. We (i) report robust seasonal information-seeking behavior for chicken pox using Google data from 36 countries, (ii) validate Google data using clinical chicken pox cases, (iii) demonstrate that Google data can be used to identify recurrent seasonal outbreaks and forecast their magnitude and seasonal timing, and (iv) reveal that VZV immunization significantly dampened seasonal cycles in information-seeking behavior. Our findings provide strong evidence that VZV transmission is seasonal and that seasonal peaks show remarkable latitudinal variation. We attribute the dampened seasonal cycles in chicken pox information-seeking behavior to VZV vaccine-induced reduction of seasonal transmission. These data and the methodological approaches provide a way to track the global burden of childhood disease and illustrate population-level effects of immunization. The global latitudinal patterns in outbreak seasonality could direct future studies of environmental and physiological drivers of disease transmission.

Keywords: Internet search; chicken pox; disease dynamics; forecast modeling; vaccination.


Conflict of interest statement

The authors declare no conflict of interest.

Figures

Fig. 1.
Fig. 1.
(Left) Global seasonality of chicken pox outbreaks measured using Google Trends as a proxy for chicken pox dynamics. Countries are organized by geographic region and latitude. Latitudinal variation in seasonal chicken pox information-seeking behavior was observed for countries with wavelet-confirmed significant seasonality. The seasonality was estimated by fitting a general additive model (GAM) to the detrended Google data from each country. GAM values using week number as the predictive variable for Google data are shown in the heat map and correspond to the GAM curves to the right. (Right) Data processing and regional GAM values. (Top Row) Data processing steps: Detrended Google data for Italy (Top Left) and box-and-whisker plot of Google data for Italy (Top Center) in which the first to third quartiles are shown in solid color with whiskers representing 95% confidence intervals. All other panels represent GAM values using week number as the predictive variable for Google data in each country. European countries include Finland, Sweden, Denmark, Ireland, Netherlands, Poland, the United Kingdom, Hungary, France, Romania, Italy, Spain, and Portugal. Asian countries include Vietnam, India, Thailand, and the Philippines. Americas include Mexico (with a peak in week 10), Colombia, Brazil, and Argentina.
Fig. 2.
Fig. 2.
Relationship between chicken pox cases and information seeking. (Left) Time series of reported chicken pox cases and information-seeking behavior for chicken pox (i.e., Google Trends data) in Mexico, Thailand, Estonia, Australia, and the United States. Google data were detrended to remove long-term trends and focus on seasonal variation in information seeking. (Right) Relationship between reported cases of chicken pox and chicken pox information seeking when both were available, with applicable R2 and P values. Chicken pox case data from Mexico and the United States were weekly, whereas chicken pox case data from Thailand, Australia, and Estonia were monthly.
Fig. 3.
Fig. 3.
(Left) Forecasting chicken pox cases using Google Trends. (Top Left) Forecasting model schematic, Google Trends data from months t2 and t1 are used to predict chicken pox cases in month t. (Middle Left) Observed and predicted chicken pox cases in Australia (active immunization) and Thailand (no immunization) from 10,000 simulations of the fitted models parameterized with the maximum likelihood estimates; overpredicted (green hash marks) and underpredicted (red hash marks) regions are indicated. (Bottom Left) Model predicted cases vs. observed chicken pox cases along the dotted 1-to-1 line. (Right) Detrended chicken pox information seeking in relation to immunization. Data are weekly; x axes indicate time, and y axes are the detrended Google data (same scale for all panels). Countries with universal (national) immunization are highlighted in red, countries with select (regional or municipal) immunization are highlighted in blue, and countries lacking any mandatory immunization are highlighted in black. (Panels 1 and 2, starting from the top) The United Kingdom and Brazil, two countries with no immunization. (Panels 3 and 4) Spain and Italy, two countries with no universal (national) immunization, but with select regional or municipal immunization. Vertical lines identify the implementation (blue for select, red for national) or termination (black) of immunization efforts. Cities and regions in these panels indicate where these efforts were focused. (Panels 5 and 6) Australia and Germany, two countries that implemented national immunization in 2004. Australia has had the vaccine since 2001, but nationwide immunization was not funded by the government until November 2005. Germany required a single dose for every child in July 2004, provided nationalized payment in 2007, and required a second dose in 2009. (Panel 7) The United States, which has had national immunization since 1995, required a booster dose in 2006.

References

    1. London WP, Yorke JA. Recurrent outbreaks of measles, chickenpox and mumps. I. Seasonal variation in contact rates. Am J Epidemiol. 1973;98(6):453–468. - PubMed
    1. Metcalf CJE, Bjornstad ON, Grenfell BT, Andreasen V. Seasonality and comparative dynamics of six childhood infections in pre-vaccination Copenhagen. Proc R Soc Lond B Biol Sci. 2009;276(1676):4111–4118. - PMC - PubMed
    1. van Panhuis WG, et al. Contagious diseases in the United States from 1888 to the present. N Engl J Med. 2013;369(22):2152–2158. - PMC - PubMed
    1. Altizer S, et al. Seasonality and the dynamics of infectious diseases. Ecol Lett. 2006;9(4):467–484. - PubMed
    1. Grassly NC, Fraser C. Seasonal infectious disease epidemiology. Proc Biol Sci. 2006;273(1600):2541–2550. - PMC - PubMed

Publication types

LinkOut - more resources