. 2016 Jun 14;113(24):6647-52.
doi: 10.1073/pnas.1523592113. Epub 2016 May 31.

Assortative mating and differential fertility by phenotype and genotype across the 20th century

Affiliations

Assortative mating and differential fertility by phenotype and genotype across the 20th century

Dalton Conley et al. Proc Natl Acad Sci U S A. .

Abstract

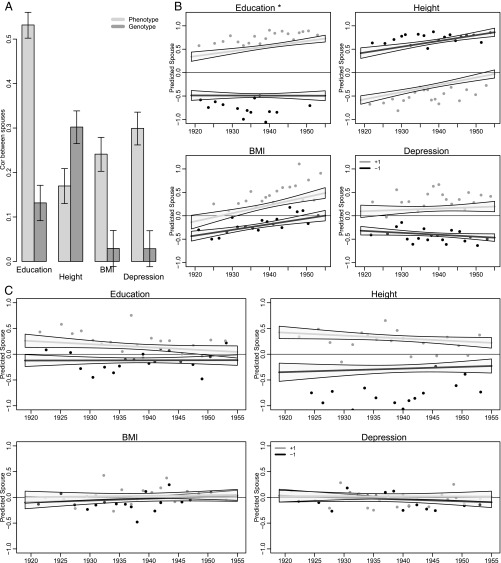
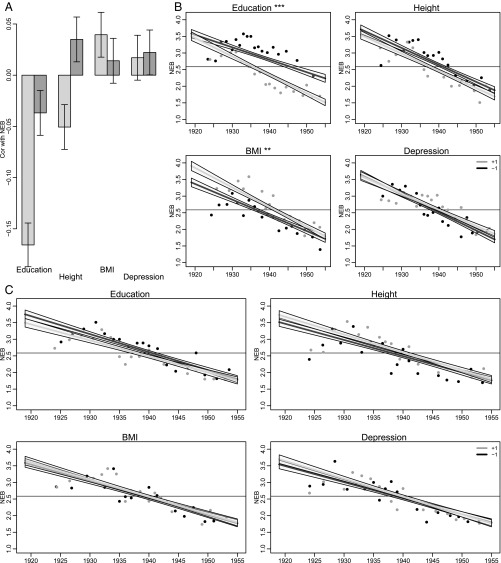
This study asks two related questions about the shifting landscape of marriage and reproduction in US society over the course of the last century with respect to a range of health and behavioral phenotypes and their associated genetic architecture: (i) Has assortment on measured genetic factors influencing reproductive and social fitness traits changed over the course of the 20th century? (ii) Has the genetic covariance between fitness (as measured by total fertility) and other traits changed over time? The answers to these questions inform our understanding of how the genetic landscape of American society has changed over the past century and have implications for population trends. We show that husbands and wives carry similar loadings for genetic factors related to education and height. However, the magnitude of this similarity is modest and has been fairly consistent over the course of the 20th century. This consistency is particularly notable in the case of education, for which phenotypic similarity among spouses has increased in recent years. Likewise, changing patterns of the number of children ever born by phenotype are not matched by shifts in genotype-fertility relationships over time. Taken together, these trends provide no evidence that social sorting is becoming increasingly genetic in nature or that dysgenic dynamics have accelerated.

Keywords: assortative mating; cohort trends; fertility; polygenic scores.


Conflict of interest statement

The authors declare no conflict of interest.

Figures

Fig. 1.
Fig. 1.
Spousal associations for both standardized phenotypes and standardized polygenic risk scores among spousal pairs in the HRS, 2012 (n = 4,686; restricted to respondents in their first marriage who have genotypic data and valid phenotypic responses). (A) All birth cohorts pooled. (B and C) Trends in spousal correspondence across birth cohorts. The horizontal axis depicts birth cohort, whereas the vertical axis is the predicted value for the spouse of a focal individual conditional on the focal individual’s birth year and either phenotype or PGS (Eq. 1). The lines show fitted values for those at 1 SD above (gray) and below (black) the mean. Points are based on binned means for two groups of respondents (standardized value below −1, black; standardized value above 1, dark gray). For each group, the distribution of birth years is divided into 20 subgroups with approximately equal numbers. Plotted points are the mean birth year and response for these subgroups. B considers standardized phenotypes. Education demonstrates a change in spousal correlation across birth cohorts. Consider education in B: an individual with relatively low education is predicted to have a spouse of consistently low education across all birth cohorts. In contrast, a high-education individual will have, on average, a spouse with higher education in later birth cohorts compared with earlier birth cohorts. For height, the fact that relatively short individuals are predicted to marry relatively tall individuals is a consequence of the fact that we are looking at opposite sex pairs. C considers standardized PGSs. In contrast to results for phenotypes, spousal correlations in education PGS display reductions across 20th century birth cohorts as do those for height, although these results do not appear significant at conventional α levels.
Fig. 2.
Fig. 2.
Association of selected phenotypes and corresponding PGSs with fertility. (A) Overall association with number of children ever born for all birth cohorts. (B and C) Birth cohort differences in associations between number of children ever born between both standardized phenotypes and standardized polygenic risk scores among non-Hispanic whites in the HRS, 2012 (n = 8,855; restricted to respondents who have genotypic data and valid phenotypic responses). The horizontal axis depicts birth cohort, whereas the vertical axis is the predicted number of offspring conditional on an individual’s birth year and either phenotype or PGS (Eq. 2). The lines show fitted values for those at 1 SD above (gray) and below (black) the mean. The horizontal line shows the mean number of offspring in the sample. Points are based on binned means for two groups of respondents (standardized value below −1, black; standardized value above 1, dark gray). For each group, the distribution of birth years is divided into 20 subgroups with approximately equal numbers. Plotted points are the mean birth year and response for these subgroups. B considers standardized phenotypes. The number of predicted offspring is lower for later birth cohorts. One important observation is that this decrease in the number of offspring is driven by the more educated. C considers standardized PGSs. The number of offspring does not appear to be changing as a function of PGSs over the birth cohorts.

References

    1. Lewontin R. The apportionment of human diversity. In: Dobzhansky T, Hecht MK, Steere WC, editors. Evolutionary Biology. Springer; New York: 1972. pp. 381–398.
    1. Gould SJ. Biological potential vs. biological determinism. Nat Hist. 1976;85(5):12–22. - PubMed
    1. Bulayeva KB, et al. Ethnogenomic diversity of Caucasus, Daghestan. Am J Hum Biol. 2006;18(5):610–620. - PubMed
    1. Laland KN, Odling-Smee J, Myles S. How culture shaped the human genome: Bringing genetics and the human sciences together. Nat Rev Genet. 2010;11(2):137–148. - PubMed
    1. Shen P, et al. Population genetic implications from DNA polymorphism in random human genomic sequences. Hum Mutat. 2002;20(3):209–217. - PubMed

Publication types

LinkOut - more resources