. 2016 Jun 14;113(24):6701-6.
doi: 10.1073/pnas.1606950113. Epub 2016 May 31.

Multidimensional structure-function relationships in human β-cardiac myosin from population-scale genetic variation

Affiliations

Multidimensional structure-function relationships in human β-cardiac myosin from population-scale genetic variation

Julian R Homburger et al. Proc Natl Acad Sci U S A. .

Abstract

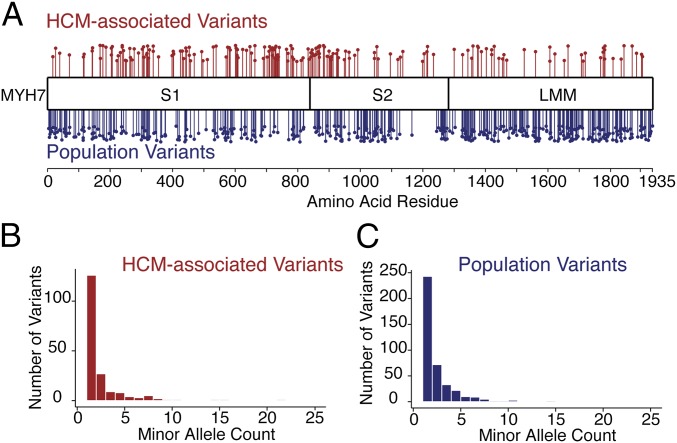
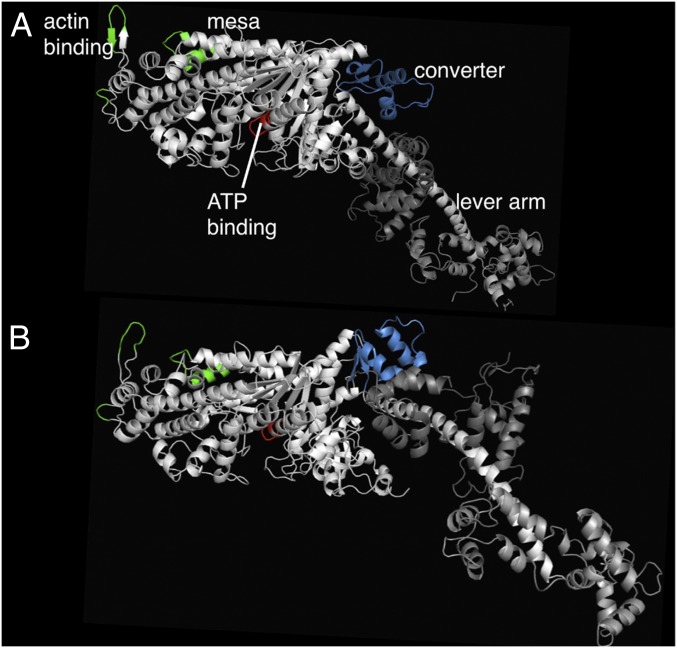
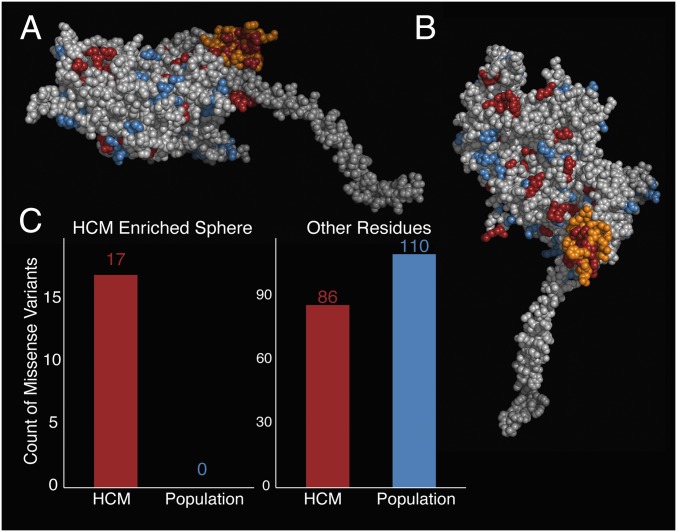
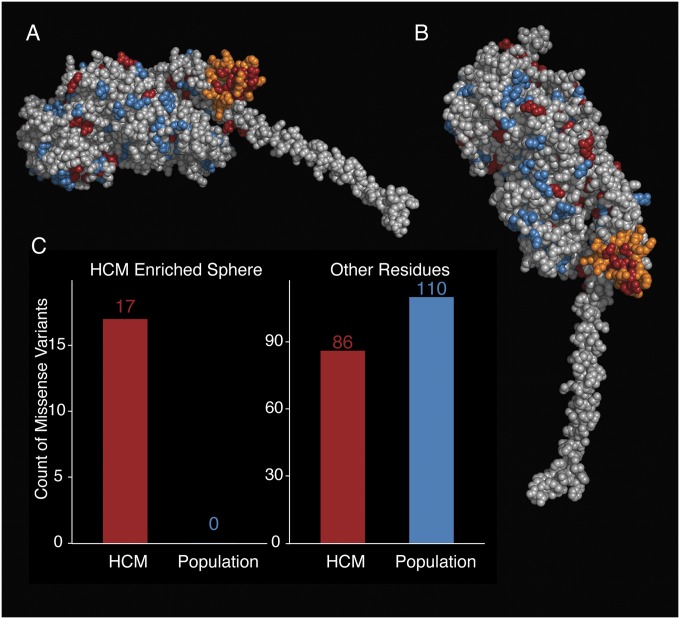
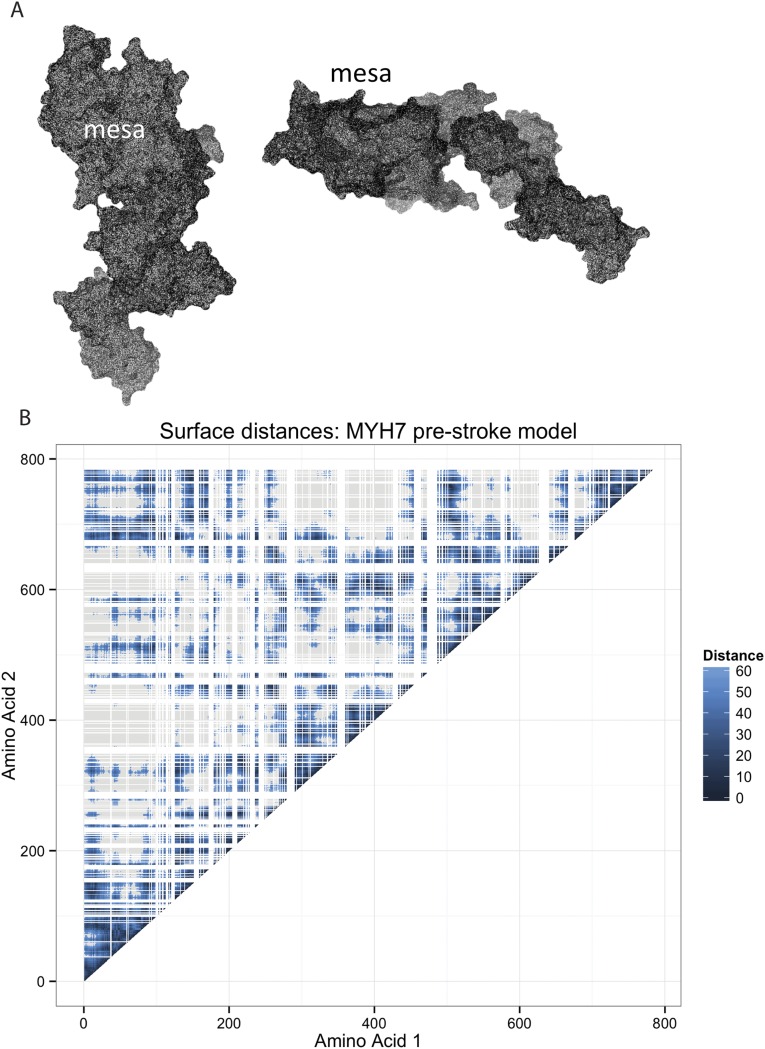
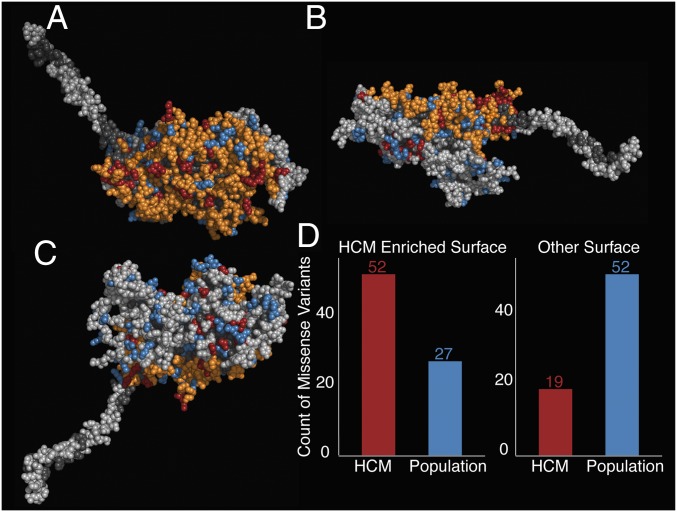
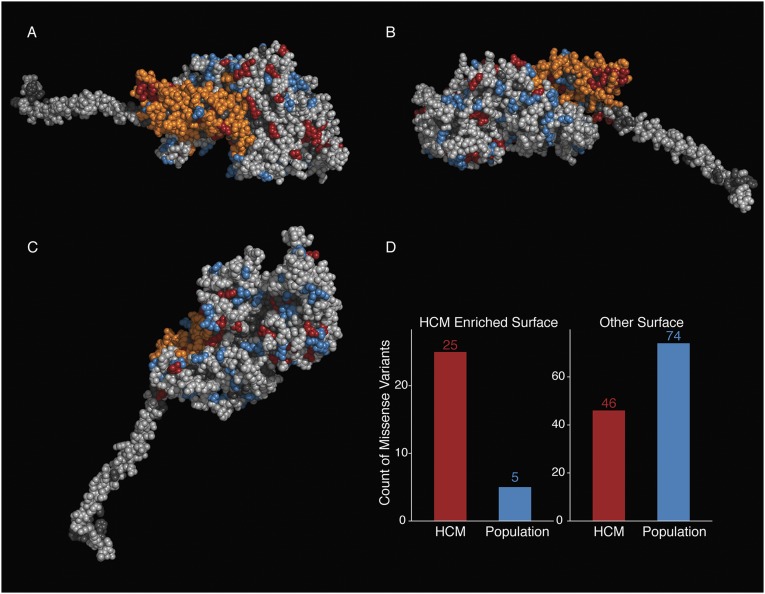
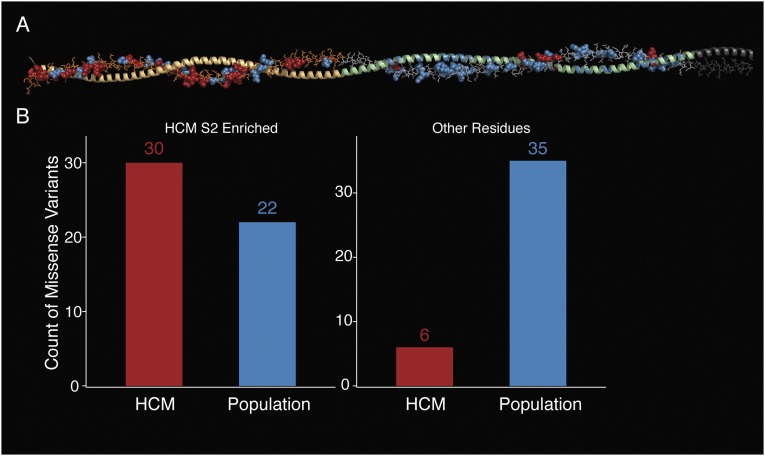
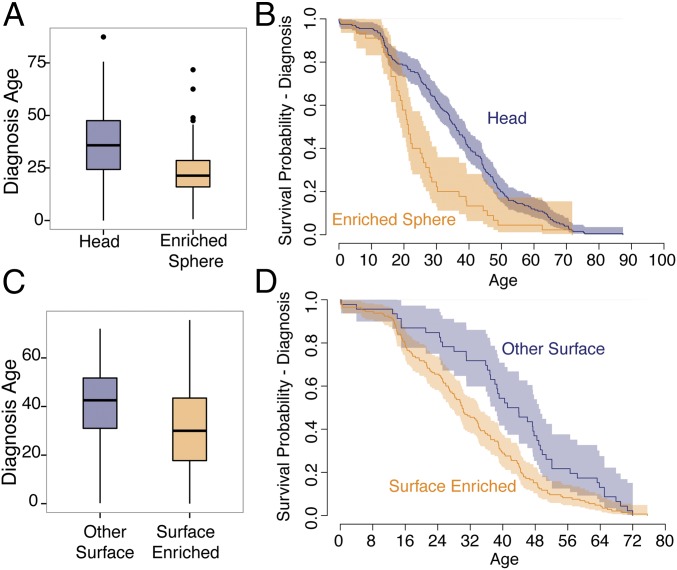
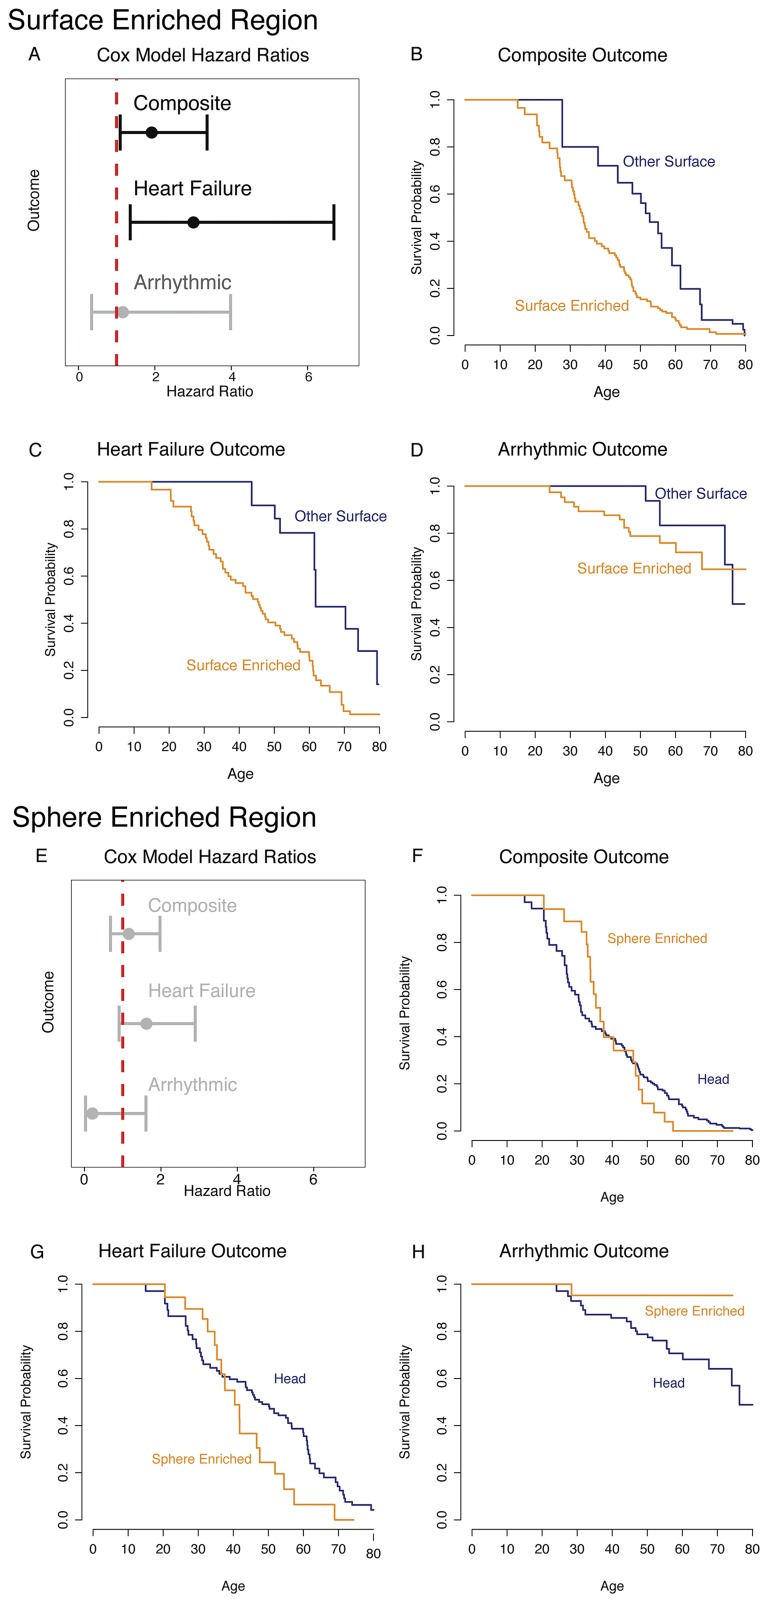
Myosin motors are the fundamental force-generating elements of muscle contraction. Variation in the human β-cardiac myosin heavy chain gene (MYH7) can lead to hypertrophic cardiomyopathy (HCM), a heritable disease characterized by cardiac hypertrophy, heart failure, and sudden cardiac death. How specific myosin variants alter motor function or clinical expression of disease remains incompletely understood. Here, we combine structural models of myosin from multiple stages of its chemomechanical cycle, exome sequencing data from two population cohorts of 60,706 and 42,930 individuals, and genetic and phenotypic data from 2,913 patients with HCM to identify regions of disease enrichment within β-cardiac myosin. We first developed computational models of the human β-cardiac myosin protein before and after the myosin power stroke. Then, using a spatial scan statistic modified to analyze genetic variation in protein 3D space, we found significant enrichment of disease-associated variants in the converter, a kinetic domain that transduces force from the catalytic domain to the lever arm to accomplish the power stroke. Focusing our analysis on surface-exposed residues, we identified a larger region significantly enriched for disease-associated variants that contains both the converter domain and residues on a single flat surface on the myosin head described as the myosin mesa. Notably, patients with HCM with variants in the enriched regions have earlier disease onset than patients who have HCM with variants elsewhere. Our study provides a model for integrating protein structure, large-scale genetic sequencing, and detailed phenotypic data to reveal insight into time-shifted protein structures and genetic disease.

Keywords: genetic burden; hypertrophic cardiomyopathy; myosin; rare disease genetics.


Conflict of interest statement

Conflict of interest statement: J.A.S. is a founder of and owns shares in Cytokinetics, Inc. and MyoKardia, Inc., biotechnology companies that are developing therapeutics that target the sarcomere. E.M.G. is an employee and owns shares in MyoKardia, Inc. E.A.A. is a founder of Personalis, Inc. C.D.B. is on the Scientific Advisory Boards of Ancestry.com, Personalis, Liberty Biosecurity, and Etalon DX, and is also a founder and chair of the Scientific Advisory Board of IdentifyGenomics.

Figures

Fig. 1.
Fig. 1.
Differences in the position of missense variants between HCM and population reference cohorts in human β-cardiac myosin. (A) Missense variants identified in SHaRe HCM patients are shown in red, and missense variants identified in ExAC individuals are shown in blue. The height of each point is offset for visibility. (B) Minor allele count of MYH7 missense variants observed in SHaRe HCM probands. (C) Minor allele count of MYH7 missense variants in the ExAC database. Fifteen missense variants with a frequency above 0.005 are not shown.
Fig. 2.
Fig. 2.
Structural models of the human β-cardiac post- and prestroke obtained by integrating data from solved crystal structures of homologous models. (A) Side view of myosin S1, with the relatively flat mesa at the top, in the poststroke state with important functional domains labeled: the actin-binding site (green residues), the ATP-binding pocket (red), the converter (blue), and the light chain-binding region or lever arm. The converter and its associated lever arm are behind the plane of the figure and below the level of the mesa. (B) Myosin S1 in the prestroke state. Small changes within the globular head region with ADP and Pi in the nucleotide pocket result in a large ∼70° rotation of the converter and lever arm. The converter is moved forward and up compared with the poststroke structure, and the lever arm is projecting forward out of the plane of the image. The distance traversed by the C-terminal end of the lever arm is ∼10 nm, the stroke size of the motor.
Fig. 3.
Fig. 3.
Spatial scan statistic identifies a spherical region of the converter domain with an increased proportion of HCM-associated variants. (A) Same side view of the prestroke S1 motor domain as shown in Fig. 1B, without the light chains attached to the α-helical light chain-binding region of the S1. The orange residues define a sphere of residues in the motor domain, which is the only region significantly enriched for HCM variants. The S1 residues are colored as follows: orange, region enriched for HCM variants; blue, missense variants seen only in the ExAC; red, missense HCM variants seen in the SHaRe; light gray, all other residues. (B) Enriched region in the prestroke model of myosin from a different perspective. The view is directly down onto the surface. Coloring is as in A. (C) Number of HCM-variants (SHaRe) and non–disease-associated (ExAC) variants identified in the spherical enriched region (Left) and in the sum of all other parts of the myosin (Right).
Fig. S1.
Fig. S1.
Poststroke model spherical spatial scan statistic identifies a region of the converter domain as enriched for HCM variants. (A) Side view of the poststroke S1 motor domain as shown in Fig. 2A, without the light chains attached to the S1. The orange residues define a sphere of residues in the motor domain, which is the only region significantly enriched for HCM variants. The S1 residues are colored as follows: orange, enriched region; blue, missense variants seen only in the ExAC; red, missense HCM variants seen in the SHaRe; light gray, all other residues. (B) Enriched region in the poststroke model of myosin, from a different perspective; coloring is as in A. (C) Number of HCM-variants (SHaRe) and non–disease-associated (ExAC) variants identified in the spherical enriched region (Left) and in the sum of all other parts of the myosin (Right).
Fig. S2.
Fig. S2.
Solvent-excluded surface mesh of myosin with the labeled mesa region and amino acid surface distances calculated for the myosin head. (A) Solvent-excluded surface is represented by a network of points in space. This weighted network is used to calculate the surface distance between any two points. The mesh was calculated using the MSMS program with a 2.5-Å surface probe. The mesa region is labeled. (B) Surface distance in angstroms between any two amino acid residues in the prestroke model of the myosin head, with darker shading indicating residues that are closer together. White lines indicate amino acids not located on the surface. Gray regions indicate distances of greater than 60 Å. Residues near each other in the linear sequence of the protein are often located near each other (dark shading along diagonal). In addition, there are many instances where residues that are far apart in the linear sequence are close together in 3D space (dark shading off the diagonal).
Fig. 4.
Fig. 4.
Surface spatial scan analysis identifies a larger surface region enriched for HCM-associated missense variation. (A) Similar view of the prestroke model to the view in Fig. 2B, looking directly down onto the mesa. The residues are colored as follows: orange, surface region enriched for HCM variants; blue, missense variants seen only in the ExAC; red, missense variants seen in the SHaRe; light gray, residues considered to be on the surface; dark gray, residues not considered to be on the surface. The HCM-enriched surface region identified covers the entire mesa plus the adjoining converter domain. (B) Same side view of the prestroke S1 motor domain as shown in Figs. 1 and 2A. (C) View of the prestroke model viewing the side opposite the mesa. This surface is not enriched for HCM variants. (D) Number of HCM variants (SHaRe) and non–disease-associated (ExAC) variants identified in the surface enriched region (Left) and in the sum of all other parts of the myosin surface (Right).
Fig. S3.
Fig. S3.
Surface spatial scan statistic identifies a smaller surface region as enriched in the myosin poststroke model. (A) Spatial scan statistic identifies an enriched surface region in the poststroke myosin model that contains many of the residues in the enriched region in the prestroke myosin model. In this view, the orange residues define the surface of residues in the motor domain, which is the region significantly enriched for HCM variants. The S1 residues are colored as follows: orange, enriched region; blue, missense variants seen only in the ExAC; red, missense HCM variants seen in the SHaRe; light gray, all other surface residues; dark gray, nonsurface residues. (B) Side view of the enriched region; coloring is as in A. (C) Nonenriched side of the poststroke myosin; coloring is as in A. (D) Number of HCM variants (SHaRe) and non–disease-associated (ExAC) variants identified in the surface enriched region (Left) and in the remaining regions of the myosin surface (Right).
Fig. S4.
Fig. S4.
Enrichment of HCM residues in the proximal part of myosin S2. (A) Molecular structure of the coiled-coil S2 fragment, modeled as described in Materials and Methods. Only one α-helix of the coiled-coil is shown in detailed structure; the second α-helix is symmetrical and shown only in cartoon mode. HCM variants are labeled in red, whereas ExAC variants are labeled in blue. Orange shading indicates the identified enriched region. (B) Number of HCM variants (SHaRe) and non–disease-associated (ExAC) variants identified in the enriched region of the S2 compared with the remainder of the S2 model.
Fig. 5.
Fig. 5.
Comparison of clinical phenotypes between enriched regions and other regions in β-cardiac myosin. (A) Age of diagnosis of patients with HCM variants in the enriched spherical converter region (orange, n = 45) compared with patients with variants in other parts of the myosin head (blue, n = 201) (Wilcoxon test: P = 6.7 × 10⁻⁵). Box plots show the median surrounded by the interquartile range (IQR), with whiskers extending to 1.5-fold the interquartile range (IQR). (B) Kaplan–Meier curves of age at diagnosis compared between HCM variants in the enriched spherical converter region (orange) and patients with variants in other parts of the myosin head (blue). Shading indicates 95% confidence intervals for the survival curve. (C) Age of diagnosis of patients with HCM variants in the enriched surface region (orange, n = 145) compared with patients with variants in other parts of the myosin head surface (blue, n = 46) (Wilcoxon test: P = 1.6 × 10⁻⁴). Box plots show the median and IQR, with whiskers extending to 1.5-fold the IQR. (D) Kaplan–Meier curves of age at diagnosis compared between HCM variants in the enriched surface region (orange) and patients with variants in other parts of the myosin head surface (blue). Shading indicates 95% confidence intervals for the survival curve.
Fig. S5.
Fig. S5.
Patients with HCN who carry a missense variant in the surface enriched region of MYH7 have an increased hazard for clinical events. (A) Hazard ratios and 95% confidence intervals for the surface enriched region for each of the three outcome classes. (B) Kaplan–Meier survival curve for the composite outcome comparing the two regions. (C) Kaplan–Meier survival curve for the heart failure outcome comparing the two regions. (D) Kaplan–Meier survival curve for the arrhythmic outcome comparing the two regions. (E) Hazard ratios and 95% confidence intervals for the spherical enriched region for each of the three outcome classes. (F) Kaplan–Meier survival curve for the composite outcome comparing the two regions. (G) Kaplan–Meier survival curve for the heart failure outcome comparing the two regions. (H) Kaplan–Meier survival curve for the arrhythmic outcome comparing the two regions.

Similar articles

Cited by

References

    1. Krendel M, Mooseker MS. Myosins: Tails (and heads) of functional diversity. Physiology (Bethesda) 2005;20:239–251. - PubMed
    1. Maron BJ, et al. Prevalence of hypertrophic cardiomyopathy in a general population of young adults. Echocardiographic analysis of 4111 subjects in the CARDIA Study. Coronary Artery Risk Development in (Young) Adults. Circulation. 1995;92(4):785–789. - PubMed
    1. Maron BJ, Casey SA, Hauser RG, Aeppli DM. Clinical course of hypertrophic cardiomyopathy with survival to advanced age. J Am Coll Cardiol. 2003;42(5):882–888. - PubMed
    1. Walsh R, Rutland C, Thomas R, Loughna S. Cardiomyopathy: A systematic review of disease-causing mutations in myosin heavy chain 7 and their phenotypic manifestations. Cardiology. 2010;115(1):49–60. - PubMed
    1. Jellis CL, Desai MY. Hypertrophic cardiomyopathy: Still connecting the dots between genotype and phenotype. Cardiovasc Diagn Ther. 2015;5(2):156–159. - PMC - PubMed

Publication types

MeSH terms

LinkOut - more resources