. 2016:2016:3760702.
doi: 10.1155/2016/3760702. Epub 2016 May 9.

Cellular Zinc Homeostasis Contributes to Neuronal Differentiation in Human Induced Pluripotent Stem Cells

Affiliations

Cellular Zinc Homeostasis Contributes to Neuronal Differentiation in Human Induced Pluripotent Stem Cells

Stefanie Pfaender et al. Neural Plast. 2016.

Abstract

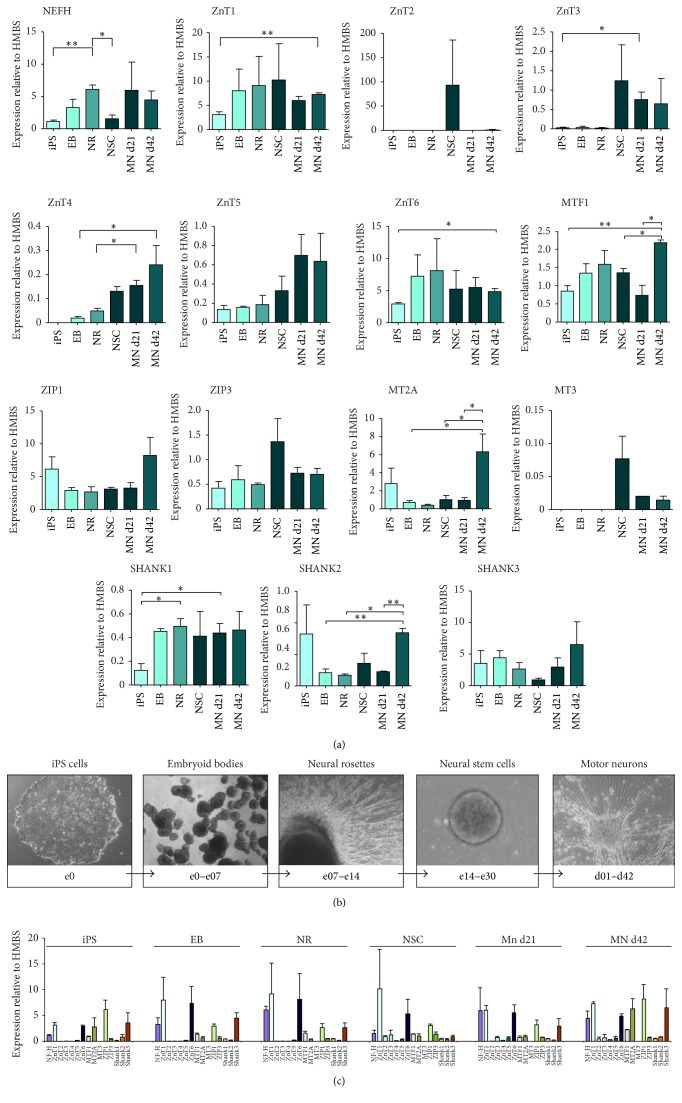
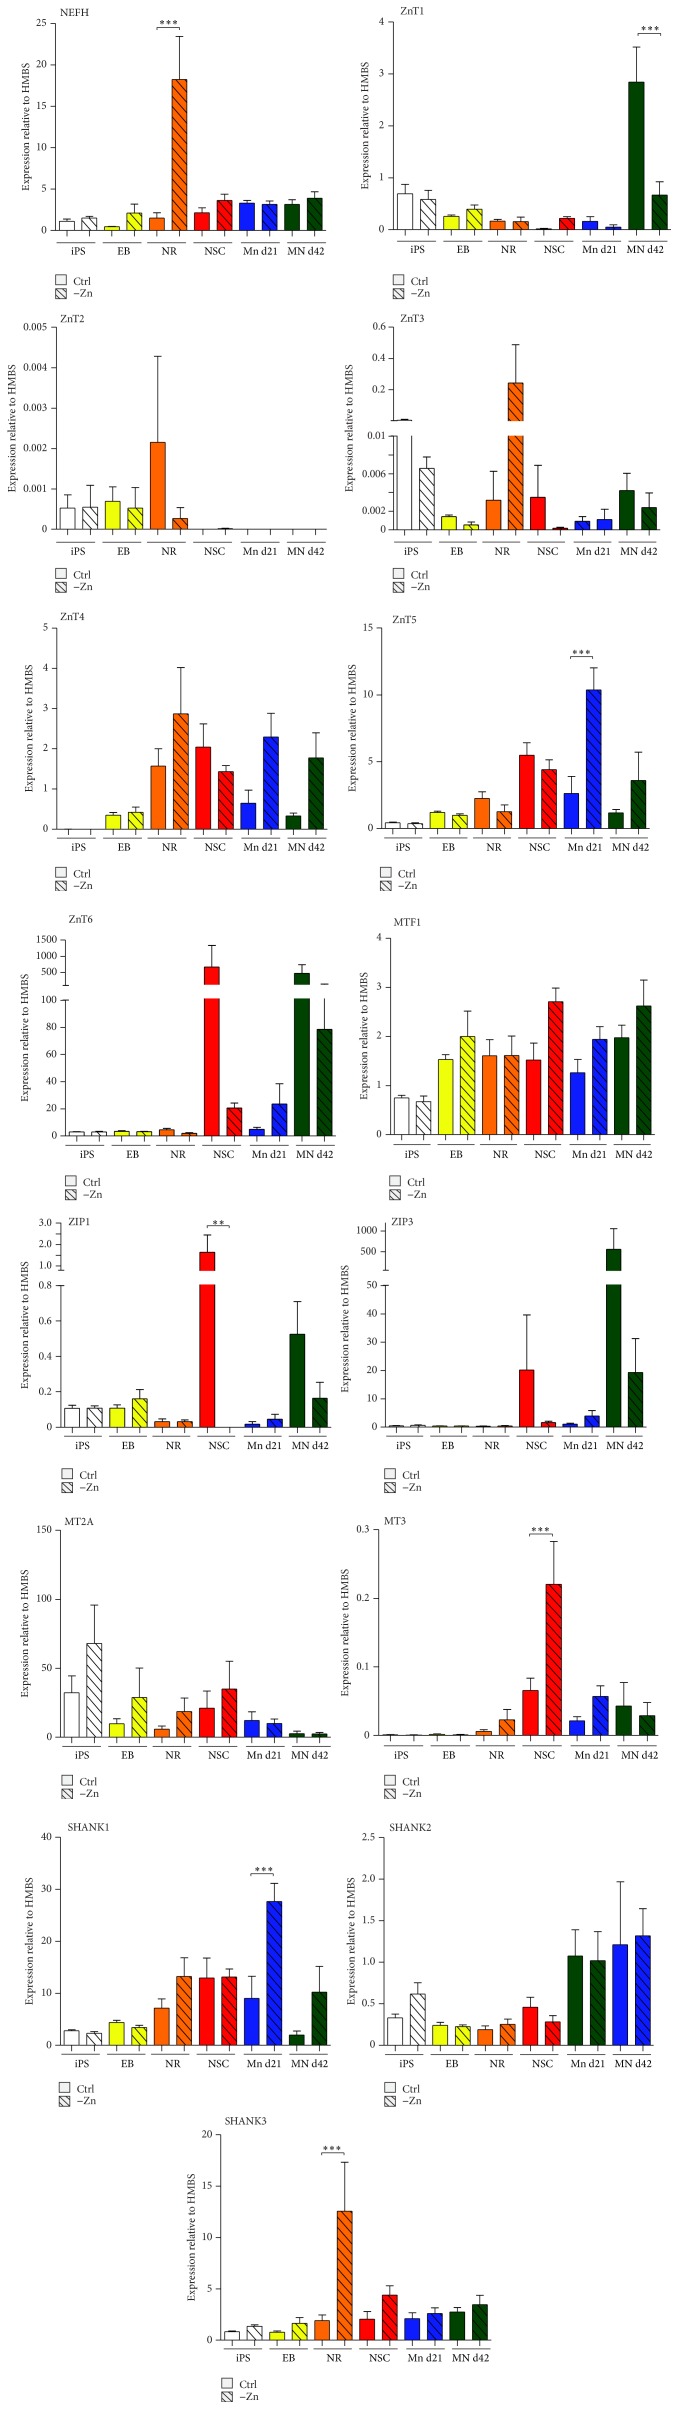
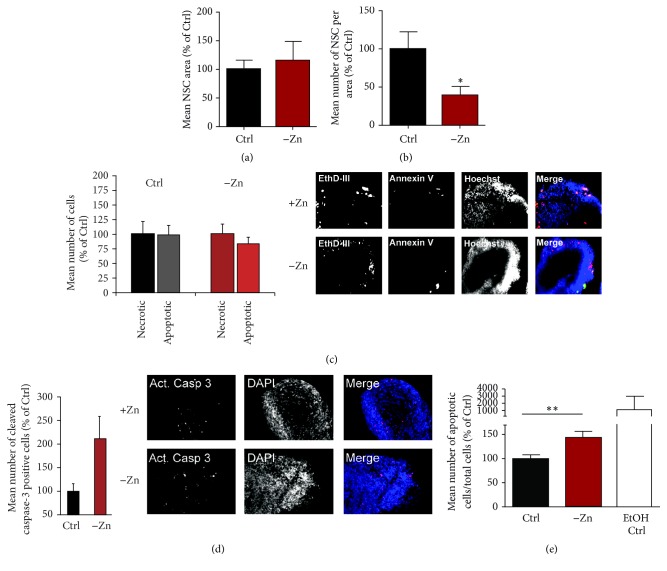
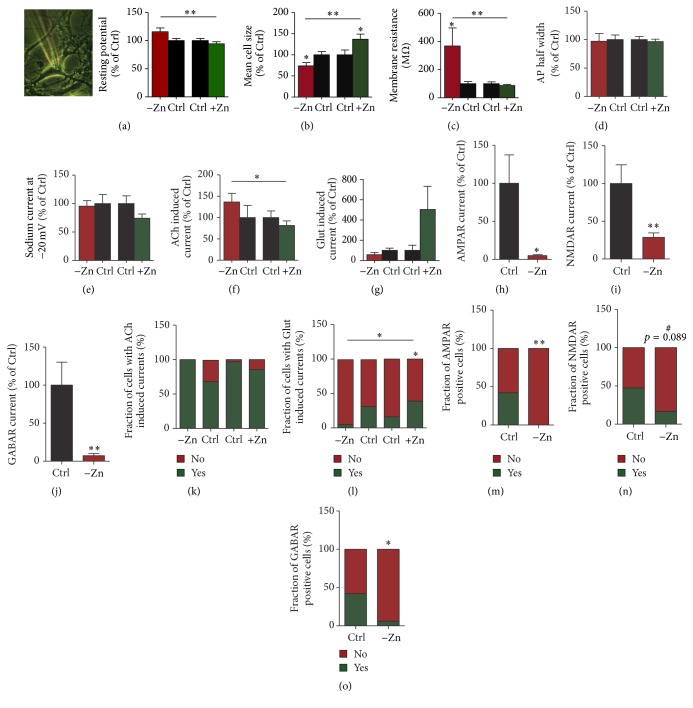
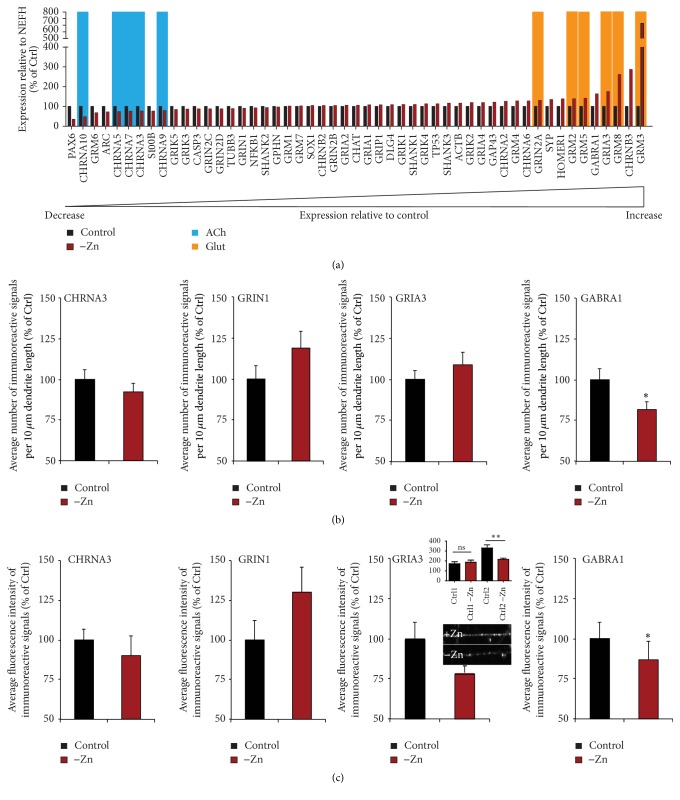
Disturbances in neuronal differentiation and function are an underlying factor of many brain disorders. Zinc homeostasis and signaling are important mediators for a normal brain development and function, given that zinc deficiency was shown to result in cognitive and emotional deficits in animal models that might be associated with neurodevelopmental disorders. One underlying mechanism of the observed detrimental effects of zinc deficiency on the brain might be impaired proliferation and differentiation of stem cells participating in neurogenesis. Thus, to examine the molecular mechanisms regulating zinc metabolism and signaling in differentiating neurons, using a protocol for motor neuron differentiation, we characterized the expression of zinc homeostasis genes during neurogenesis using human induced pluripotent stem cells (hiPSCs) and evaluated the influence of altered zinc levels on the expression of zinc homeostasis genes, cell survival, cell fate, and neuronal function. Our results show that zinc transporters are highly regulated genes during neuronal differentiation and that low zinc levels are associated with decreased cell survival, altered neuronal differentiation, and, in particular, synaptic function. We conclude that zinc deficiency in a critical time window during brain development might influence brain function by modulating neuronal differentiation.


Figures

Figure 1
Figure 1
Expression of zinc homeostasis genes during stem cell differentiation into motor neurons. (a) Quantitative evaluation of mRNA expression levels normalized to HMBS of selected zinc homeostasis and the zinc-dependent SHANK genes. Analyses were performed in triplicate (n = 3) and the mean normalized expression is shown. Neurofilament H (NEFH) expression was used to control successful differentiation and increases significantly in NRs and rises again after a significant decrease in NSC in suspension (iPSC versus NR: p = 0.0028; NR versus NSC: p = 0.0175). Several zinc transporters show developmental stage-dependent expression as well as altered expression levels during differentiation. Expression of ZnT1 is significantly increased in motor neurons at d42 compared to the iPS cell stage (p = 0.0086). ZnT2 expression in turn was only detected above background in NSC. Expression of ZnT3 is very low in early stages (iPS, EB, and NR) but increases in NSC and becomes significant in motor neurons (iPSC versus MN d21: p = 0.0239) in which ZnT3 levels remain elevated. No expression of ZnT4 was detected in iPS cells, but mRNA levels gradually increase from EB to motor neurons (EB versus MN d42: p = 0.0352; NR versus MN d21: p = 0.0384). This is also observed for ZnT5 expression; however it is only seen as trend. Additionally, the expression of ZnT6 was found to be significantly higher in motor neurons compared to iPS cells (iPS versus MN d42: p = 0.0178). Along with the increase in expression of some zinc transporters during motor neuron differentiation, the mRNA levels of MTF1 are significantly higher in motor neurons compared to iPS cells (iPSC versus MN d42: p = 0.0074; NSC versus MN d42: p = 0.0170; MN d21 versus MN d42: p = 0.0263). While ZIP1 and ZIP3 are expressed on similar level through all stages of motor neuron differentiation, the expression of MT2A shows some variance in iPSC but otherwise is significantly higher in motor neurons compared to most previous stages and significantly increases in motor neurons between d21 and d42 (EB versus MN d42: p = 0.0347; NSC versus MN d42: p = 0.0474; MN d21 versus MN d42: p = 0.0397). The expression of MT3 in turn could only be detected in NSC and motor neurons but not in earlier stages. Although SHANK proteins are associated with synapses that only occur in motor neurons, their expression can be already detected in iPS cells and later stages of motor neuron differentiation. SHANK1 and SHANK2 expression increases towards later stages (SHANK1: iPSC versus NR: p = 0.0225; iPSC versus MN d21: p = 0.0327) (SHANK2: EB versus MN d42: p = 0.0061; NR versus MN d42: p = 0.0132; MN d21 versus MN d42: p = 0.0017), although the expression of SHANK2 in iPS cells shows high variability. SHANK3 is expressed on similar level throughout differentiation. (b) Representative images of hiPSC undergoing differentiation to motor neurons (MN) via the generation of embryoid bodies (EB), neural rosettes (NR), and neural stem cells (NSC). (c) Comparison of mRNA expression levels across different zinc homeostasis genes. In general, expression levels of ZnT1 and ZnT6 were the highest compared to other ZnTs across all developmental stages. Similarly, ZIP1 expression was high throughout all phases of motor neuron differentiation, while MTF1 and MT2A expression increased in old motor neurons. p ≤ 0.05; ∗∗ p ≤ 0.01.
Figure 2
Figure 2
Zinc deficiency alters the expression of zinc homeostasis genes during stem cell differentiation into motor neurons. Quantitative evaluation of mRNA expression levels normalized to HMBS of selected zinc homeostasis and the zinc-dependent SHANK genes. Data shows the average normalized gene expression based on n = 6 measurements. Neurofilament H (NEFH) expression was used to control successful differentiation. For statistical analysis, a 1-way ANOVA was used followed by Tukey's multiple comparison test. Several zinc transporters show expression levels depending on the availability of zinc in the medium. Comparing cells grown in zinc depleted medium with cells grown in medium which was resupplemented with zinc in the amount used in control medium after zinc depletion, a significant difference in ZnT1 expression was found in d42 motor neurons (one-way ANOVA: p < 0.0001; MN d42 Ctrl versus −Zn: p < 0.05). No significant difference was detected regarding the expression of ZnT2, ZnT3, ZnT4, ZnT6, and MTF1 comparing controls and zinc deficient conditions. The expression of ZnT5 was significantly increased in motor neurons at d21 under zinc deficient conditions (one-way ANOVA: p < 0.0001; MN d21 Ctrl versus −Zn: p < 0.05). The expression of ZIP1 was significantly reduced in neuronal stem cells under zinc deficient conditions (one-way ANOVA: p = 0.0012; NSC Ctrl versus −Zn: p < 0.05). The expression of ZIP3 was not found to be altered, similar to the expression levels of MT2A. MT3 expression was significantly higher in neuronal stem cells under zinc deficient conditions (one-way ANOVA: p < 0.0001; NSC Ctrl versus −Zn: p < 0.05). The expression of SHANK1 was increased in motor neurons at d21 under zinc deficient conditions (one-way ANOVA: p < 0.0001; MN d21 Ctrl versus −Zn: p < 0.05) and the expression of SHANK3 in neural rosettes under zinc deficient conditions (one-way ANOVA: p < 0.0001; NR Ctrl versus −Zn: p < 0.05). No change was observed for SHANK2 expression. ∗∗ p ≤ 0.01; ∗∗∗ p ≤ 0.001.
Figure 3
Figure 3
Zinc deficiency significantly impairs iPS cell differentiation. (a) The average size of NSC clusters is not significantly altered upon zinc deficiency. (b) The mean number of NSC clusters per area measured on a 10 cm petri dish is significantly reduced in zinc deficient conditions (t-test, p = 0.0281; n = 8). (c) Apoptosis and necrosis were evaluated for the NSC stage during differentiation. No difference in the number of cells labeled with markers for apoptosis or necrosis was found between zinc deficient and zinc sufficient media (t-test, n = 20). Right panel: exemplary images of NSC stained with annexin V labeled with FITC (apoptotic cells) and ethidium homodimer III (necrotic cells) and DAPI (total number of cells). (d) The mean number of cells showing signals specific for cleaved caspase-3 was increased under zinc deficient conditions seen as trend (t-test, p = 0.09; n = 20). Right panel: exemplary images of NSC stained with anti-active caspase-3 antibody and DAPI. (e) A significant increase in apoptotic cells was detected in embryoid bodies grown under zinc deficient conditions using the ApoTox-Glo Triplex Assay (t-test, p = 0.0098; n = 12). p ≤ 0.05; ∗∗ p ≤ 0.01.
Figure 4
Figure 4
Altered zinc levels affect glutamatergic signaling. (a) Representative image of a neuron used for patch-clamp electrophysiological studies (left panel). Right panel: a significant difference in resting potentials was detected between cells grown under zinc deficient and zinc supplemented conditions (t-test, p = 0.0028; n = 19: Ctrl−Zn and −Zn, n = 32: Ctrl+Zn, and n = 42: +Zn). (b) A significant difference in membrane capacity was detected between cells grown under zinc deficient and zinc supplemented conditions (t-test, Ctrl−Zn versus  −Zn, p = 0.0228; Ctrl+Zn versus +Zn, p = 0.0273; −Zn versus +Zn, p = 0.0016; n = 19: Ctrl−Zn and −Zn; n = 32: Ctrl+Zn, n = 42: +Zn). (c) A significant difference in membrane resistance was detected between cells grown under zinc deficient and zinc supplemented conditions (t-test, Ctrl−Zn versus  −Zn, p = 0.0445; −Zn versus +Zn, p = 0.0018; n = 19: Ctrl−Zn and −Zn; n = 32: Ctrl+Zn; n = 42: +Zn). (d) Single cell patch-clamp electrophysiology did not show any significant differences in the half-width of induced action potentials (AP) and sodium currents (e). (f) A significant increase in acetylcholine (ACh) induced currents was observed in zinc deficient cells when compared to zinc supplemented cells (t-test, −Zn versus +Zn, p = 0.050; n = 19: Ctrl−Zn and −Zn, n = 32: Ctrl+Zn, and n = 42: +Zn). (g) A decrease in glutamate (Glut) induced currents can be seen under zinc deficient conditions as trend. (h) AMPAR currents and NMDAR currents (i) as well as GABAR currents (j) were significantly decreased after differentiation of cells in zinc depletion conditions (t-test, AMPAR, p = 0.0186; NMDAR, p = 0.0099; GABAR, p = 0.0067; n = 19: Ctrl−Zn, n = 18: −Zn, n = 31: Ctrl+Zn, and n = 41: +Zn). (k) The number of cells showing ACh induced currents was higher in zinc deficient conditions. (l) The number of cells showing Glut induced currents was significantly less under zinc deficient conditions when compared to zinc supplemented cells (contingency (Chi square) test, p = 0.0113). The fraction of cells with Glut induced currents was also significantly increased in zinc supplemented cells compared to controls (contingency (Chi square) test, p = 0.04) (n = 19: Ctrl−Zn, n = 18: −Zn, n = 31: Ctrl+Zn, and n = 41: +Zn). (m) The fraction of cells with AMPAR currents (m) and NMDAR currents (n) as well as GABAR currents (o) was decreased after differentiation of cells in zinc depletion conditions (contingency (Chi square) test, AMPAR, p = 0.0031; NMDAR, p = 0.089; GABAR, p = 0.0198; n = 19: Ctrl−Zn; n = 17-18: −Zn). All currents were normalized to cell size.  #trend (p value between 0.05 and 0.1). p ≤ 0.05; ∗∗ p ≤ 0.01.
Figure 5
Figure 5
Cells differentiated under different zinc levels show altered gene expression and protein levels of neurotransmitter receptors. (a) A screening for the expression of genes associated with glutamatergic and cholinergic neurotransmission as well as synapse plasticity reveals a decrease of ACh receptors, mainly CHRNA3, CHRNA5, CHRNA7, CHRNA9, and CHRNA10, while an increase in glutamate receptor expression (GRM2, GRM3, and GRM5; GRIA3; GRIN2A) was observed. (b) Immunocytochemical analysis of n = 20 cells per condition. The mean number of signals per dendrite length was assessed. No differences were detected for CHRNA3, GRIN1, and GRIA3. A significant reduction was seen for GABRA1 signals (t-test, p = 0.05). (c) Immunocytochemical analysis of n = 20 cells per condition. The mean signal intensity per fluorescent puncta was assessed. No differences were detected for CHRNA3 and GRIN1. A significant reduction of GABRA1 signal intensity (t-test, p = 0.022) was observed. GRIA3 signal intensity was reduced only in one cell line (t-test, p = 0.0045). ns: not significant. p ≤ 0.05; ∗∗ p ≤ 0.01.

References

    1. Morris D. R., Levenson C. W. Zinc regulation of transcriptional activity during retinoic acid-induced neuronal differentiation. Journal of Nutritional Biochemistry. 2013;24(11):1940–1944. doi: 10.1016/j.jnutbio.2013.06.002. - DOI - PMC - PubMed
    1. Chowanadisai W., Graham D. M., Keen C. L., Rucker R. B., Messerli M. A. A zinc transporter gene required for development of the nervous system. Communicative and Integrative Biology. 2013;6(6) doi: 10.4161/cib.26207.e26207 - DOI - PMC - PubMed
    1. Levenson C. W., Morris D. Zinc and neurogenesis: making new neurons from development to adulthood. Advances in Nutrition. 2011;2(2):96–100. doi: 10.3945/an.110.000174. - DOI - PMC - PubMed
    1. Marks P. A. Histone deacetylase inhibitors: a chemical genetics approach to understanding cellular functions. Biochimica et Biophysica Acta (BBA)—Gene Regulatory Mechanisms. 2010;1799(10–12):717–725. doi: 10.1016/j.bbagrm.2010.05.008. - DOI - PMC - PubMed
    1. Tapiero H., Tew K. D. Trace elements in human physiology and pathology: zinc and metallothioneins. Biomedicine and Pharmacotherapy. 2003;57(9):399–411. doi: 10.1016/s0753-3322(03)00081-7. - DOI - PubMed

Publication types

LinkOut - more resources