

EZH2 regulates neuroepithelium structure and neuroblast proliferation by repressing p21
- PMID: 27248655
- PMCID: PMC4852452
- DOI: 10.1098/rsob.150227
EZH2 regulates neuroepithelium structure and neuroblast proliferation by repressing p21
Abstract
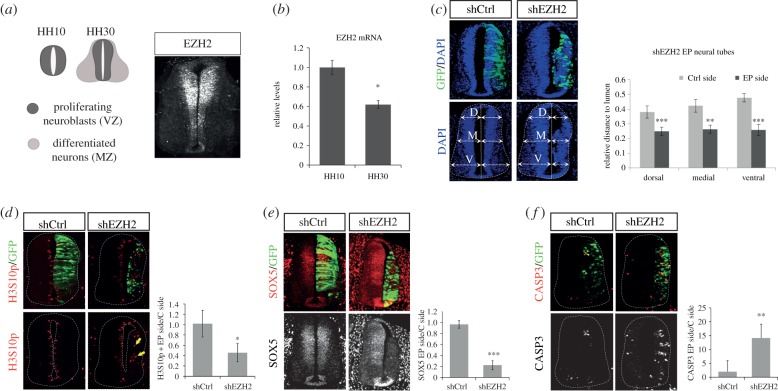
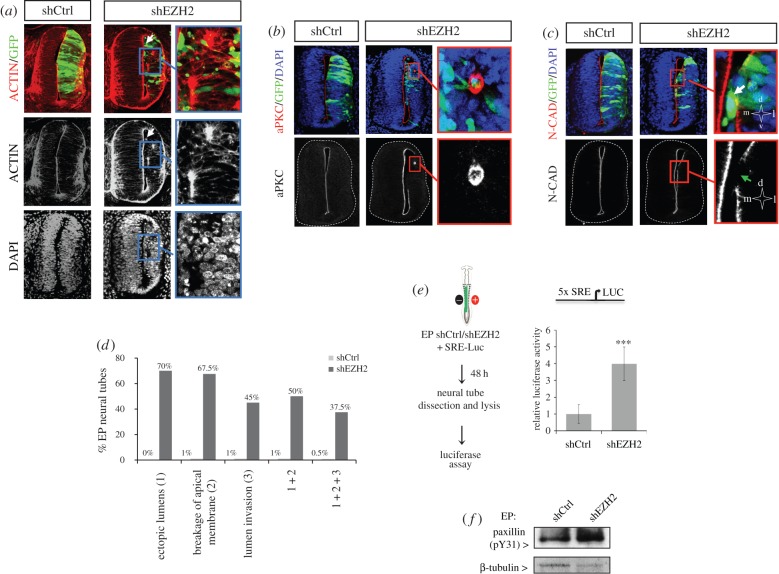
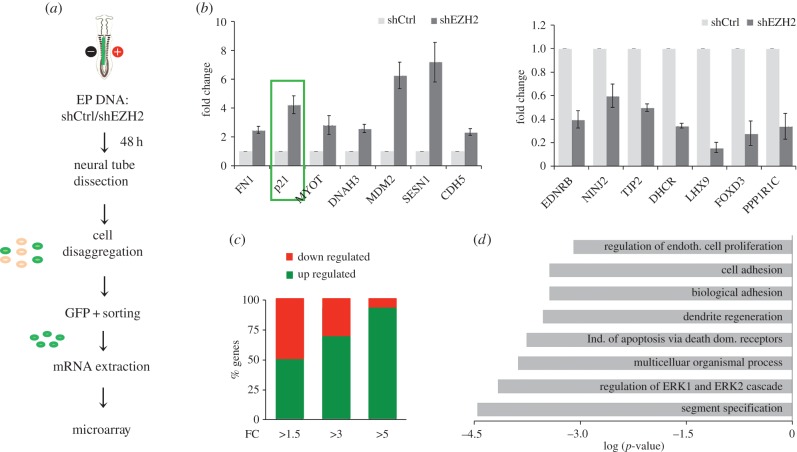
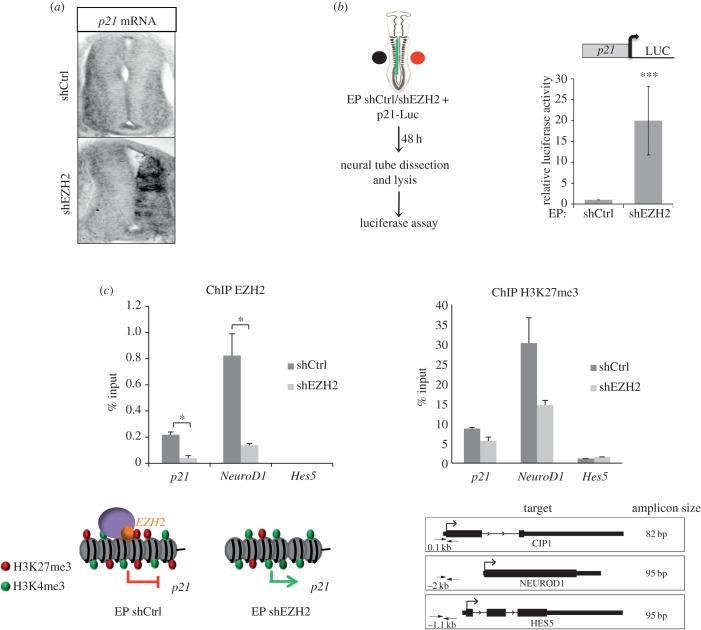
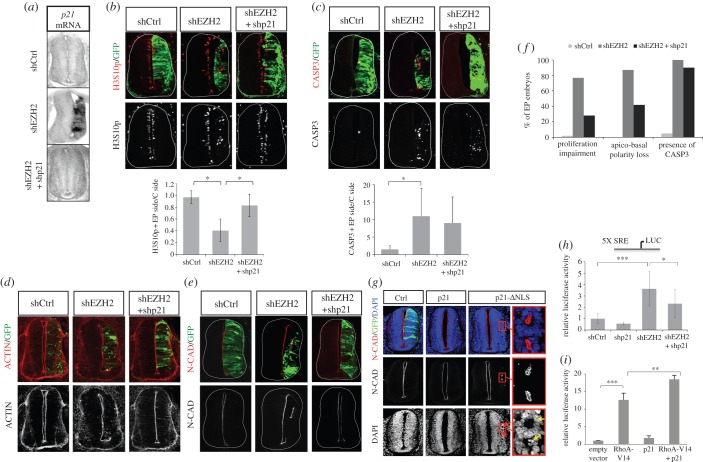
The function of EZH2 as a transcription repressor is well characterized. However, its role during vertebrate development is still poorly understood, particularly in neurogenesis. Here, we uncover the role of EZH2 in controlling the integrity of the neural tube and allowing proper progenitor proliferation. We demonstrate that knocking down the EZH2 in chick embryo neural tubes unexpectedly disrupts the neuroepithelium (NE) structure, correlating with alteration of the Rho pathway, and reduces neural progenitor proliferation. Moreover, we use transcriptional profiling and functional assays to show that EZH2-mediated repression of p21(WAF1/CIP1) contributes to both processes. Accordingly, overexpression of cytoplasmic p21(WAF1/CIP1) induces NE structural alterations and p21(WAF1/CIP1) suppression rescues proliferation defects and partially compensates for the structural alterations and the Rho activity. Overall, our findings describe a new role of EZH2 in controlling the NE integrity in the neural tube to allow proper progenitor proliferation.
Keywords: EZH2; gene silencing; histone methylation; neural development; neuroblast proliferation.
© 2016 The Authors.
Figures
Similar articles
-
SOX19b regulates the premature neuronal differentiation of neural stem cells through EZH2-mediated histone methylation in neural tube development of zebrafish.Stem Cell Res Ther. 2019 Dec 16;10(1):389. doi: 10.1186/s13287-019-1495-3. Stem Cell Res Ther. 2019. PMID: 31842983 Free PMC article.
-
MYCN contributes to the malignant characteristics of erythroleukemia through EZH2-mediated epigenetic repression of p21.Cell Death Dis. 2017 Oct 12;8(10):e3126. doi: 10.1038/cddis.2017.526. Cell Death Dis. 2017. PMID: 29022893 Free PMC article.
-
EZH2-shRNA-mediated upregulation of p21waf1/cip1 and its transcriptional enhancers with concomitant downmodulation of mutant p53 in pancreatic ductal adenocarcinoma.Surgery. 2013 Oct;154(4):739-46; discussion 746-7. doi: 10.1016/j.surg.2013.06.041. Surgery. 2013. PMID: 24074410
-
Control of asymmetric cell division of mammalian neural progenitors.Dev Growth Differ. 2012 Apr;54(3):277-86. doi: 10.1111/j.1440-169X.2012.01345.x. Dev Growth Differ. 2012. PMID: 22524601 Review.
-
The Golgi Apparatus in Polarized Neuroepithelial Stem Cells and Their Progeny: Canonical and Noncanonical Features.Results Probl Cell Differ. 2019;67:359-375. doi: 10.1007/978-3-030-23173-6_15. Results Probl Cell Differ. 2019. PMID: 31435803 Review.
Cited by
-
Gain and loss of function variants in EZH1 disrupt neurogenesis and cause dominant and recessive neurodevelopmental disorders.Nat Commun. 2023 Jul 11;14(1):4109. doi: 10.1038/s41467-023-39645-5. Nat Commun. 2023. PMID: 37433783 Free PMC article.
-
Abnormal methylation caused by folic acid deficiency in neural tube defects.Open Life Sci. 2022 Dec 22;17(1):1679-1688. doi: 10.1515/biol-2022-0504. eCollection 2022. Open Life Sci. 2022. PMID: 36589786 Free PMC article. Review.
-
Zbtb38 is a novel target for spinal cord injury.Oncotarget. 2017 Jul 11;8(28):45356-45366. doi: 10.18632/oncotarget.17487. Oncotarget. 2017. PMID: 28514761 Free PMC article.
-
EZH2 orchestrates apicobasal polarity and neuroepithelial cell renewal.Neurogenesis (Austin). 2016 Nov 17;3(1):e1250034. doi: 10.1080/23262133.2016.1250034. eCollection 2016. Neurogenesis (Austin). 2016. PMID: 28090544 Free PMC article.
-
Variational autoencoding of gene landscapes during mouse CNS development uncovers layered roles of Polycomb Repressor Complex 2.Nucleic Acids Res. 2022 Feb 22;50(3):1280-1296. doi: 10.1093/nar/gkac006. Nucleic Acids Res. 2022. PMID: 35048973 Free PMC article.
References
-
- Schuettengruber B, Chourrout D, Vervoort M, Leblanc B, Cavalli G. 2007. Genome regulation by polycomb and trithorax proteins. Cell 128, 735–745. (doi:10.1016/j.cell.2007.02.009) - DOI - PubMed
-
- Ringrose L, Paro R. 2007. Polycomb/Trithorax response elements and epigenetic memory of cell identity. Development 134, 223–232. (doi:10.1242/dev.02723) - DOI - PubMed
-
- Czermin B, Melfi R, McCabe D, Seitz V, Imhof A, Pirrotta V. 2002. Drosophila enhancer of Zeste/ESC complexes have a histone H3 methyltransferase activity that marks chromosomal Polycomb sites. Cell 111, 185–196. (doi:10.1016/S0092-8674(02)00975-3) - DOI - PubMed
-
- Muller J, et al. 2002. Histone methyltransferase activity of a Drosophila Polycomb group repressor complex. Cell 111, 197–208. (doi:10.1016/S0092-8674(02)00976-5) - DOI - PubMed
-
- Cao R, Wang L, Wang H, Xia L, Erdjument-Bromage H, Tempst P, Jones RS, Zhang Y. 2002. Role of histone H3 lysine 27 methylation in Polycomb-group silencing. Science 298, 1039–1043. (doi:10.1126/science.1076997) - DOI - PubMed
Publication types
MeSH terms
Substances
LinkOut - more resources
Full Text Sources
Other Literature Sources
Molecular Biology Databases
