

Predicting and measuring fluid responsiveness with echocardiography
- PMID: 27249550
- PMCID: PMC4989101
- DOI: 10.1530/ERP-16-0008
Predicting and measuring fluid responsiveness with echocardiography
Abstract
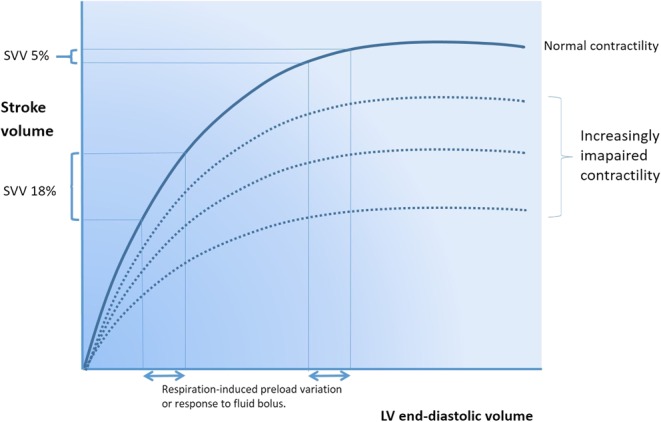
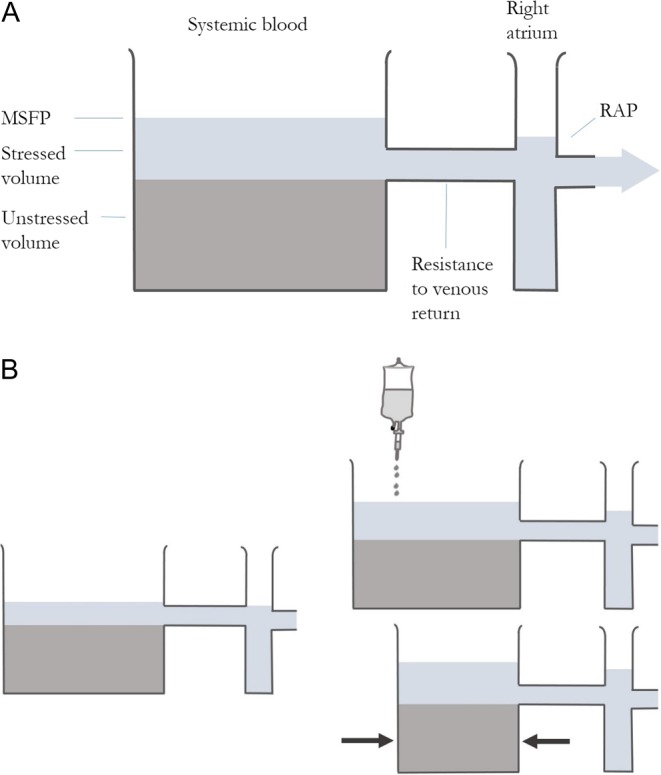
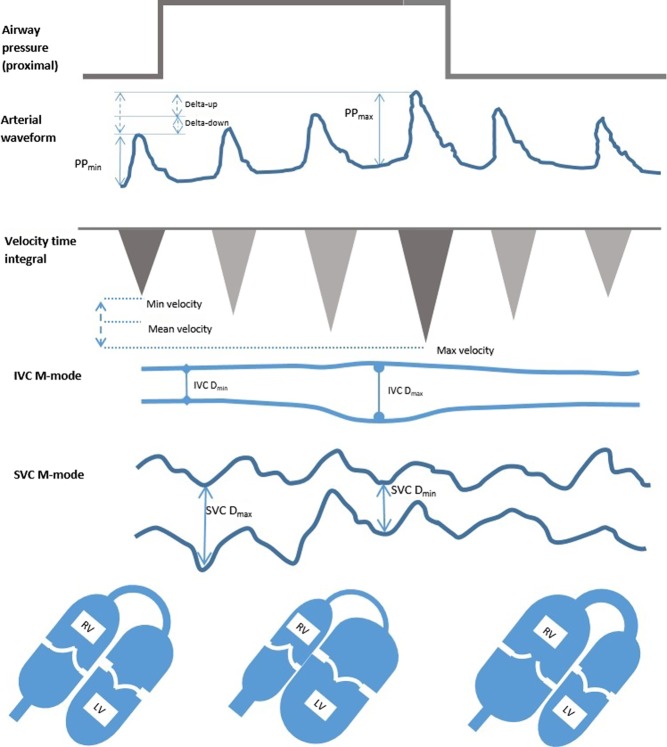
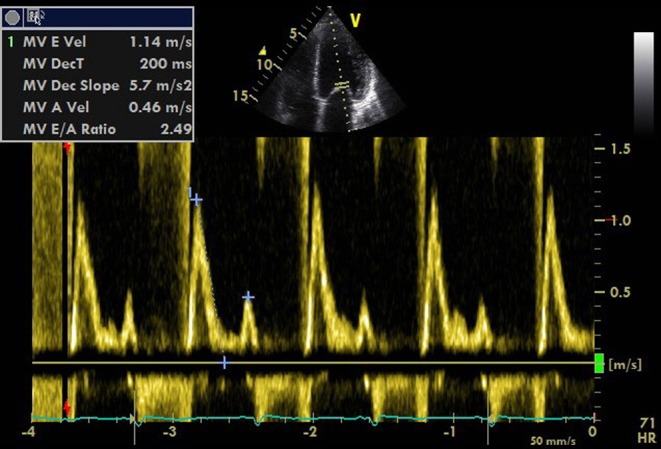
Echocardiography is ideally suited to guide fluid resuscitation in critically ill patients. It can be used to assess fluid responsiveness by looking at the left ventricle, aortic outflow, inferior vena cava and right ventricle. Static measurements and dynamic variables based on heart-lung interactions all combine to predict and measure fluid responsiveness and assess response to intravenous fluid resuscitation. Thorough knowledge of these variables, the physiology behind them and the pitfalls in their use allows the echocardiographer to confidently assess these patients and in combination with clinical judgement manage them appropriately.
Keywords: echocardiography; guidelines; haemodynamics; ultrasound protocols; ventricular function.
© 2016 The authors.
Figures
Similar articles
-
[Experts consensus on the management of the right heart function in critically ill patients].Zhonghua Nei Ke Za Zhi. 2017 Dec 1;56(12):962-973. doi: 10.3760/cma.j.issn.0578-1426.2017.12.017. Zhonghua Nei Ke Za Zhi. 2017. PMID: 29202543 Chinese.
-
Predicting fluid responsiveness: A review of literature and a guide for the clinician.Am J Emerg Med. 2018 Nov;36(11):2093-2102. doi: 10.1016/j.ajem.2018.08.037. Epub 2018 Aug 14. Am J Emerg Med. 2018. PMID: 30122506 Review.
-
Respiratory variations of inferior vena cava fail to predict fluid responsiveness in mechanically ventilated patients with isolated left ventricular dysfunction.Ann Intensive Care. 2019 Oct 7;9(1):113. doi: 10.1186/s13613-019-0589-5. Ann Intensive Care. 2019. PMID: 31591663 Free PMC article.
-
Development of a fluid resuscitation protocol using inferior vena cava and lung ultrasound.J Crit Care. 2016 Feb;31(1):96-100. doi: 10.1016/j.jcrc.2015.09.016. Epub 2015 Sep 25. J Crit Care. 2016. PMID: 26475100 Review.
-
Inferior vena cava collapsibility detects fluid responsiveness among spontaneously breathing critically-ill patients.J Crit Care. 2017 Oct;41:130-137. doi: 10.1016/j.jcrc.2017.05.008. Epub 2017 May 12. J Crit Care. 2017. PMID: 28525778
Cited by
-
Critical Care Echocardiography: A Primer for the Nephrologist.Adv Chronic Kidney Dis. 2021 May;28(3):244-251. doi: 10.1053/j.ackd.2021.02.002. Adv Chronic Kidney Dis. 2021. PMID: 34906309 Free PMC article. Review.
-
Influence of Supervised Maternal Aerobic Exercise during Pregnancy on 1-Month-Old Neonatal Cardiac Function and Outflow: A Pilot Study.Med Sci Sports Exerc. 2023 Nov 1;55(11):1977-1984. doi: 10.1249/MSS.0000000000003227. Epub 2023 Jun 1. Med Sci Sports Exerc. 2023. PMID: 37259255 Free PMC article. Clinical Trial.
-
Urgency Prediction for Medical Laboratory Tests Through Optimal Sparse Decision Tree: Case Study With Echocardiograms.JMIR AI. 2025 Jan 29;4:e64188. doi: 10.2196/64188. JMIR AI. 2025. PMID: 39879091 Free PMC article.
-
End-expiratory Occlusion Test and Mini-fluid Challenge Test for Predicting Fluid Responsiveness in Acute Circulatory Failure.J Emerg Trauma Shock. 2023 Jul-Sep;16(3):109-115. doi: 10.4103/jets.jets_44_23. Epub 2023 Aug 10. J Emerg Trauma Shock. 2023. PMID: 38025504 Free PMC article.
-
Liberal versus restrictive fluid therapy in critically ill patients.Intensive Care Med. 2019 Oct;45(10):1440-1442. doi: 10.1007/s00134-019-05713-y. Epub 2019 Aug 9. Intensive Care Med. 2019. PMID: 31399779 No abstract available.
References
LinkOut - more resources
Full Text Sources
Other Literature Sources
Medical
