. 2016 Jun 2:6:27195.
doi: 10.1038/srep27195.

EphrinB2 regulates the emergence of a hemogenic endothelium from the aorta

Affiliations

EphrinB2 regulates the emergence of a hemogenic endothelium from the aorta

Inn-Inn Chen et al. Sci Rep. .

Abstract

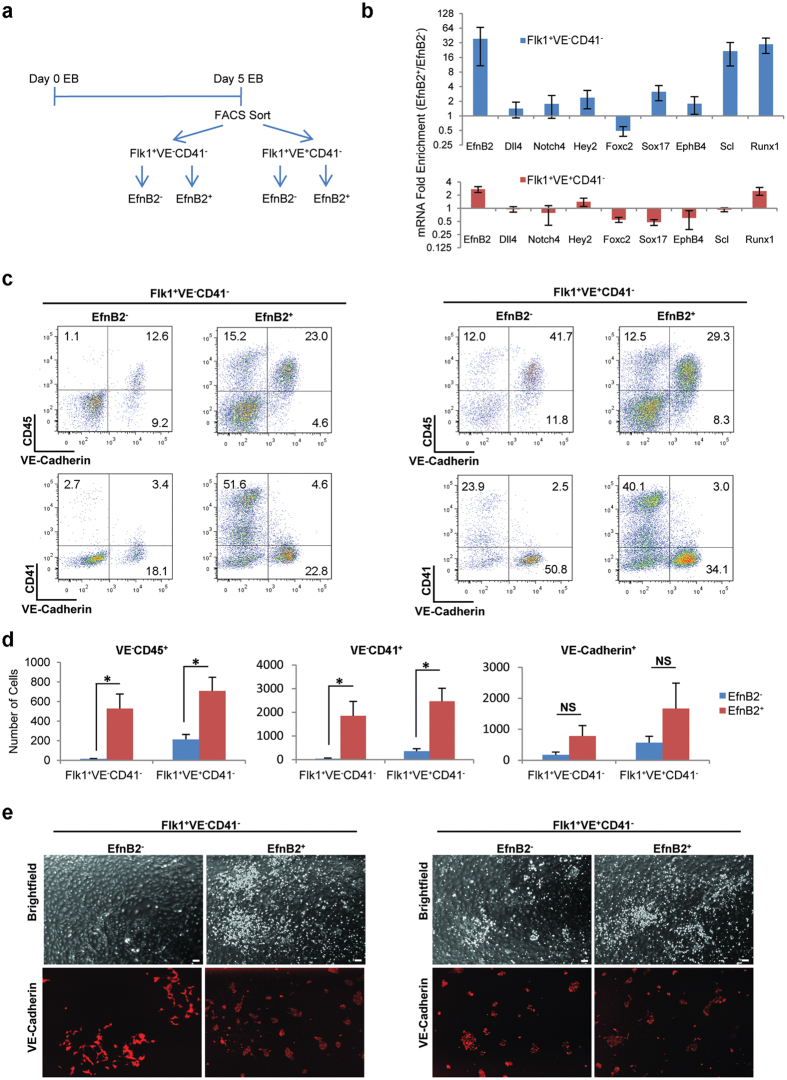
Adult-type intraembryonic hematopoiesis arises from specialized endothelial cells of the dorsal aorta (DA). Despite the critical importance of this specialized endothelium for establishment of hematopoietic stem cells and adult hematopoietic lineages, the mechanisms regulating its emergence are incompletely understood. We show that EphrinB2, a principal regulator of endothelial cell function, controls the development of endothelium producing adult-type hematopoiesis. The absence of EphrinB2 impairs DA-derived hematopoiesis. Transmembrane EphrinB2 and its EphB4 receptor interact in the emerging DA, which transiently harbors EphrinB2(+) and EphB4(+) endothelial cells, thereby providing an opportunity for bi-directional cell-to-cell signaling to control the emergence of the hemogenic endothelium. Embryonic Stem (ES) cell-derived EphrinB2(+) cells are enriched with hemogenic endothelial precursors. EphrinB2 silencing impairs ES generation of hematopoietic cells but not generation of endothelial cells. The identification of EphrinB2 as an essential regulator of adult hematopoiesis provides important insight in the regulation of early hematopoietic commitment.


Figures

Figure 1
Figure 1. EfnB2 deficiency impairs ex vivo hematopoiesis from the DA but not YS.
(a,b) Relative mRNA levels of the indicated genes in DAs resected from EfnB2−/−, EfnB2+/− and EfnB2+/+ littermate embryos at E9.0–9.5 (a) 18–28 somite stage; EfnB2−/−: n = 4; EfnB2+/−: n = 13; EfnB2+/+: n = 8 or 9; four litters) and E10.0–10.5 (b) 20–36 somite stage; low somite counts reflect EfnB2−/− embryo growth retardation; EfnB2−/−: n = 4; EfnB2+/−: n = 10; EfnB2+/+: n = 5; three litters) Individual data points (dot/square/triangle) are from individual DAs; mean (horizontal lines) ± SEM (error bars) are also shown. P values from unpaired Student t-test; *P < 0.05. (c) Number of CD45+, CD41+ and VE-Cadherin+ cells recovered from five-day OP9 co-culture of single-cell suspended E9.0–9.5 DAs (18–28 somite stage); EfnB2−/− (n = 11), EfnB2+/− (n = 7) and EfnB2+/+ (n = 10) littermates (four litters). Each data point (dot/square/triangle) represents the number of positive cells per resected aorta (1 embryo equivalent); mean (horizontal lines) ± SEM (error bars) are also shown. OP9 cells were excluded by forward/side scatter profiles. P values from unpaired Student t-test; *P < 0.05. (d) Immunofluorescent detection of VE-Cadherin (red) and CD45 (green) in representative Day 5 OP9 co-cultures of single-cell suspended DAs from E9.0–9.5 EfnB2−/−, EfnB2+/− and EfnB2+/+ littermates. Corresponding brightfield images are shown. Scale bar: 100 μm. (e,f) Myeloid and erythroid colonies recovered after 9–12 days methylcellulose culture of single-cell suspended YSs from E7.5–8.5 (e) 0–12 somite stage; EfnB2−/−: n = 5; EfnB2+/−: n = 14; EfnB2+/+: n = 15) and E9.0–9.5 (f) 18–28 somite stage; EfnB2−/−: n = 6; EfnB2+/−: n = 9; EfnB2+/+: n = 13) littermates. Bar graphs show mean myeloid (blue) and erythroid (red) colonies/50 × 103 cells) + SEM (error bars). P values (>0.05) are from unpaired Student t-test.
Figure 2
Figure 2. EphrinB2-deficient YSs generate a variety of erythroid and myeloid cells.
(a) Morphology of EfnB2−/− cytospun cells and (b) flow cytometric analysis of EfnB2+/+(n = 2) + EfnB2+/− (n = 6) and EfnB2−/− (n = 3) cells recovered from 5-day methylcellulose culture of single-cell suspended YSs at E9.5. Erythroid cells (ery) macrophages (mac), megakaryocytes (mk), neutrophils (n) and occasional mast cells (m) are identified morphologically; Wright’s stain or H&E where noted (a). Lineage-specific markers (b) show similar (all comparisons P values > 0.05) representation of hematopoietic (CD45+), erythroid cells (Ter119+), macrophages (F4/80+), erythroid (Ter119) and endothelial (VE-cadherin+) cells from individual cultures (colonies pooled) of E9.5 EfnB2+/+, EfnB2+/− and EfnB2−/− YSs. (d–g) Immunohistochemical detection of embryonic-type (βH1 globin, green) and adult-type (Beta-t globin, red) globins in nucleated (Hoechst+, blue) cells within EfnB2+/+ and EfnB2−/− E9.0–9.5 YSs. The low magnification images (d) show areas (limited by a dotted line) magnified in (e) the arrowheads point to red-only cells that contain adult-type Beta-t globin only (e). Quantitation of nucleated cells containing adult-type Beta-t globin only (red) and nucleated cells containing embryonic-type (βH1+) globin alone (green) or with adult-type Beta-t globin (yellow) in EfnB2+/+ (n = 5) and EfnB2−/− (n = 5) in E9.0–9.5 YSs (f,g). Each dot reflects the mean red and green fluorescence intensity in each cell; at least 200 cells were evaluated/YS; a total of 1164 (EfnB2+/+) and 1399 (EfnB2−/−) cells were measured; the dotted line limits background green fluorescence. The % cells containing adult-type Beta-t globin only (βH1Beta-t+ cells) is shown. (g) Flow cytometric analysis of EfnB2+/+ (n = 2)+EfnB2+/− (n = 3) and EfnB2−/− (n = 3) cells recovered from 5-day OP9 culture of single-cell suspended YSs at E9.5 showing a similar distribution (all comparisons P values > 0.05) of lineage-specific markers, including CD11b+/Ly6G+ (Ly6G granulocytes), CD11b+/Ly6C+ (Ly6C monocytic) cells. (h) Morphology of EfnB2−/− cytospun cells after staining with Wright’s stain. Error bars: standard deviations.
Figure 3
Figure 3. Association of EfnB2 and EphB4 expressed in neighboring endothelial cells of the developing DA.
(a) Schematic lateral view of the DA in mouse embryo at E8.5; the dotted line indicates the location of head removal from embryo in test sample. CV: cardinal vein; DA: dorsal aorta. (b) Clarified embryo (E8.5, 8 somites) after removal of the head and side wall; CD31 immunostaining (green); Hoechst staining (blue); and PLA (EfnB2+EphB4, pink). The dotted box limits the longitudinal area magnified in the upper panels in c; the solid line within the dotted box indicates the plane of cross section for the area magnified in the bottom panels in c. H: heart. (c) PLA shows that EfnB2 is associated with EphB4 in the ventral floor of the DA from a WT embryo (8 somite stage); longitudinal slice shown in the upper panels; cross-section view is shown in the bottom panels. Red: EfnB2+EphB4 PLA signal; blue: Hoechst (DNA/nuclei); green: CD31 (endothelium). The DA is outlined by the dotted line. FG: foregut. NT: neural tube. The arrowheads point to PLA signal from proximity co-localization of EfnB2 and EphB4.
Figure 4
Figure 4. EfnB2 silencing impairs hematopoiesis from ES-derived endothelium.
(a) Kinetics of gene expression during ES/EB differentiation. Each GAPDH-normalized gene expression value was normalized across all time points (maximum expression = 1). Results reflect mean relative mRNA expression ± SEM (error bars); three independent experiments. (b) Schematic of experiment. Single-cell suspended Day 4 ES/EBs were re-aggregated at high density with EfnB2 shRNA/PGK/no lentivirus. After 48 hours, VE-Cadherin+CD41 cells (GFP+ for shRNA/PGK) were sorted, analyzed and cultured (OP9 stroma or methylcellulose medium). VE: VE-Cadherin. (c,d) Surface VE-Cadherin and CD41 in shRNA, PGK and Uninfected ES/EB cells at differentiation Day 6 (GFP+ for shRNA/PGK). (c) Representative flow cytometry profiles (% cells in each quadrant). (d) Mean percent CD41+ and VE-Cadherin+ cells + SEM (error bars); three independent experiments. NS: non significant; P values (>0.05) from paired Student t-test. (e) Fold mRNA enrichment in GFP+VE+CD41 cells (shRNA versus PGK); differentiation Day 6. Fold change: ratio of GAPDH-normalized value in the shRNA sample/corresponding GAPDH-normalized PGK value. Mean fold enrichment ± SEM (error bars); log2 scale bar: 10 μm; three independent experiments. (f,g) Surface VE-Cadherin, CD41 and CD45 in EfnB2 shRNA, PGK and uninfected cells after five-day culture on OP9 stroma; prior to OP9 co-culture, the VE-Cadherin+CD41 cells were sorted on ES/EB differentiation Day 6 (GFP+ gate for shRNA and PGK). (f) Representative flow cytometry profiles (% cells in each quadrant); (g) Mean cell number recovered (from 25,000 cells re-plated) + SEM (error bars); three independent experiments. NS: non significant; *P value (<0.05) from paired Student t-test. (h) Immunofluorescent detection of VE-Cadherin (red), CD41 (blue) and GFP (green) after five-day OP9 co-culture of sorted VE-Cadherin+CD41 cells (GFP+ shRNA & PGK samples); corresponding brightfield images (left quadrants). Scale bars: 200 μm (i) Myeloid (blue) and erythroid (red) colonies quantified after 9–12 days methylcellulose culture of sorted VE-Cadherin+CD41 cells (GFP+ shRNA & PGK samples). Mean colony number (50,000 re-plated cells) + SEM (error bars) are shown; three independent experiments (paired Student t-test on total colony counts; *p < 0.05).
Figure 5
Figure 5. EfnB2 is not necessary for hematopoietic differentiation in Blast Colony-Forming Cell culture.
(a) Kinetics of gene expression during Blast Colony-Forming Cell (BL-CFC) culture in Flk1+ cells sorted from Day 4 ES/EBs. Gene expression was evaluated in the Flk1+ cells sorted at Day 4 (4 EB) and at the indicated time-points during BL-CFC culture (1BL-4BL). Each GAPDH-normalized mRNA expression level was normalized across all time points (maximum expression = 1). Data points: mean relative mRNA expression ± SEM (error bars); three independent experiments. (b) Schematic of experiment. Day 0 ES/EBs were infected with shRNA or PGK, or left uninfected. At Day 4 of differentiation, Flk1+ cells (GFP+ for shRNA and PGK samples) were sorted and transferred to BL-CFC culture. (c) Relative EfnB2 mRNA levels in Flk1+ (GFP+ for shRNA and PGK samples) cells sorted from shRNA/PGK/Uninfected ES/EBs on Day 4 of differentiation. Mean + SEM (error bars); three independent experiments (paired Student t-test; *p < 0.05, **p < 0.01). (d–f) Surface c-kit+, CD41+ and VE-Cadherin+ cells in Day 2 (d,e) and Day 4 (f,g) BL-CFC cultures of Flk1+ cells (GFP+ for shRNA and PGK samples) sorted on Day 4 of ES/EB differentiation. (d,f) Representative flow cytometry profiles (% cells in each quadrant indicated) (e,g) Mean percentage positive + SEM (error bars); three independent experiments; blue bars: shRNA-infected cells; red bars: PGK control infected cells; green bars: uninfected cells.
Figure 6
Figure 6. Endogenous EfnB2 expression marks ES cells with enhanced hematopoietic potential.
(a) Schematic of experiment. EfnB2+ and EfnB2 cells within the Flk1+VE-CadherinCD41 and Flk1+VE-Cadherin+CD41 populations were sorted from ES/EBs at Day 5 of differentiation. Cells were analyzed immediately and after five-day culture on OP9 stroma. (b) Selected mRNAs enrichment in sorted populations of EfnB2+ versus EfnB2 cells from Day 5 ES/EB differentiation. Blue bars: Flk1+VE-CadherinCD41; red bars: and Flk1+VE-Cadherin+CD41. Fold enrichment is calculated as the ratio of GAPDH-normalized values in the EfnB2+ population divided by the corresponding EfnB2 population. Mean fold enrichment ± SEM (error bars); log2 scale; three independent experiments. (c,d) Recovery of VE-CadherinCD45+, VE-CadherinCD41+, and VE-Cadherin+ cells from five-day OP9 co-culture of EfnB2+ and EfnB2 cells (Flk1+VE-CadherinCD41 and Flk1+VE-Cadherin+CD41 populations). (c) Representative cell surface profiles; EfnB2+ and EfnB2 cells of Flk1+VE-CadherinCD41 (left) and Flk1+VE-Cadherin+CD41 populations (right); (% cells in each quadrant indicated). (d) Number of cells with the indicated cell surface markers (VE-CadherinCD45+, VE-CadherinCD41+ and VE-Cadherin+) recovered after five-day culture on OP9 stroma. Mean cell number (per 25 × 103 cultured cells) + SEM (error bars); three independent experiments; *p < 0.05 and NS: not significant (paired Student t-test).

References

    1. Clements W. K. & Traver D. Signalling pathways that control vertebrate haematopoietic stem cell specification. Nat. Rev. Immunol. 13, 336–348, doi: 10.1038/nri3443 (2013). - DOI - PMC - PubMed
    1. Palis J., Robertson S., Kennedy M., Wall C. & Keller G. Development of erythroid and myeloid progenitors in the yolk sac and embryo proper of the mouse. Development 126, 5073–5084 (1999). - PubMed
    1. Medvinsky A. & Dzierzak E. Definitive hematopoiesis is autonomously initiated by the AGM region. Cell 86, 897–906 (1996). - PubMed
    1. Muller A. M., Medvinsky A., Strouboulis J., Grosveld F. & Dzierzak E. Development of hematopoietic stem cell activity in the mouse embryo. Immunity 1, 291–301 (1994). - PubMed
    1. Jaffredo T., Gautier R., Eichmann A. & Dieterlen-Lievre F. Intraaortic hemopoietic cells are derived from endothelial cells during ontogeny. Development 125, 4575–4583 (1998). - PubMed

Publication types